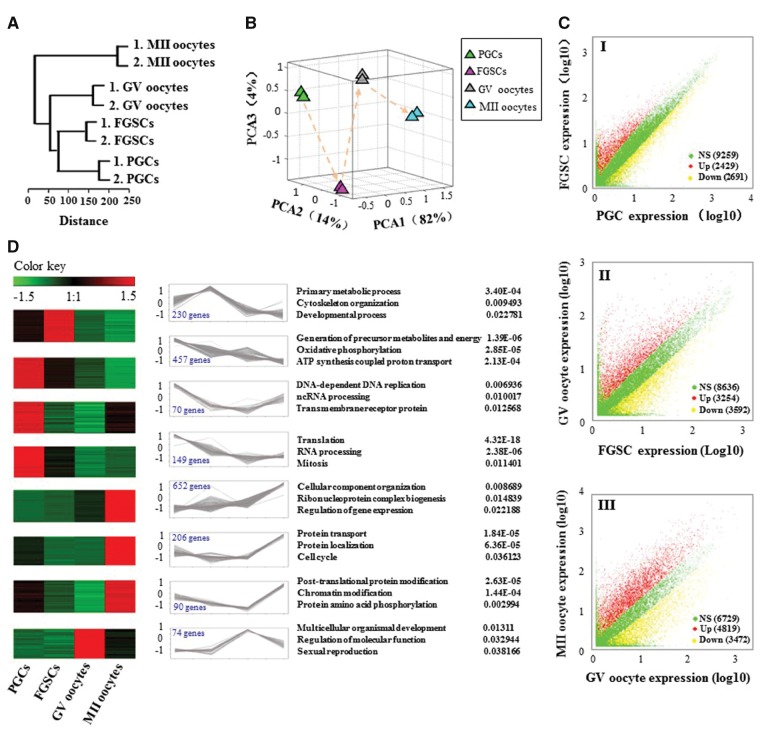
Figure 2.
Global expression patterns of known RefSeq genes in the mouse female germline development. (A) Unsupervised clustering of the transcriptomes of PGCs, FGSCs, GV and MII oocytes. All RefSeq genes expressed with RPKM ≥ 0.1 were used for the analysis. (B) PCA of the transcriptomes of PGCs, FGSCs, GV and MII oocytes. Cells from the same developmental stage are shown with the same colour. The arrows indicate the developmental direction between consecutive stages. PCA1, PCA2 and PCA3 represent the top three dimensions of the genes showing differential expression from PGCs to MII oocytes, which account for 82%, 14% and 4% of the expressed RefSeq genes, respectively. (C) Scatter plots of RPKM between PGCs and FGSCs, FGSCs and GV oocytes, and GV and MII oocytes. Red, blue and yellow dots represent genes that were up-regulated, no significant change and down-regulated, respectively. The numbers in parentheses represent the numbers of genes. (D) Clusters of genes showing representative expression patterns in the mouse female germline. The top GO terms and corresponding enrichment P-values are shown on the right side.

