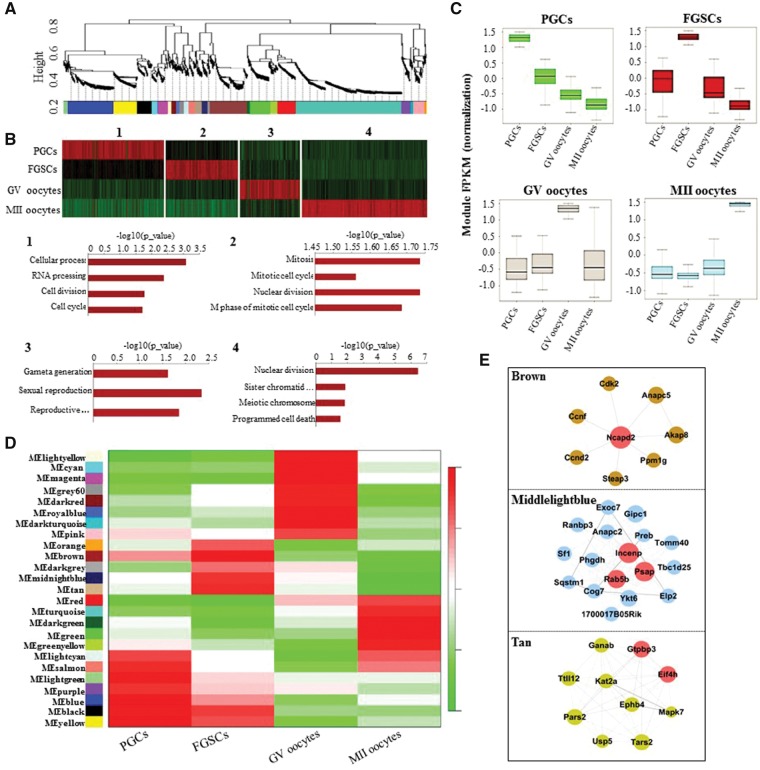
Figure 5.
WGCNA revealed gene-network modules enriched in the female germline. (A) Hierarchical cluster tree shows co-expression modules identified using WGCNA. (B) GO enrichment and heatmap showing the stage-specific developmental events. Several modules were functionally aggregated and mapped to each stage with different biological processes. The most strongly related GO terms and their corresponding P-values are shown. (C) Boxplots showing the distribution of module expression (mean RPKM of all expressed genes in each module) for different cell types. (D) Heatmap reporting the correlations between each module and developmental stage. Colour legend indicates the level of correlation between gene co-expression and stage-specific expression. (E) Hub-gene networks of the FGSC-specific modules. Size of the dots represents hubness.

