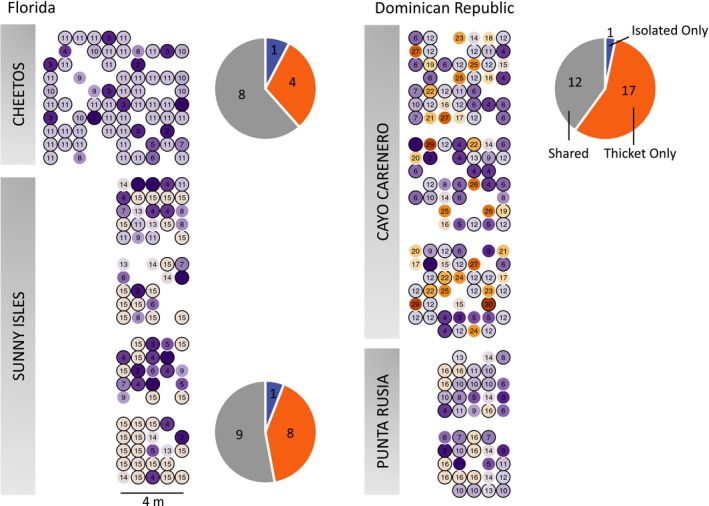
Figure 3.

Spatial patterns of relatedness in thickets. Grids represent explicit spatial relationship of clonality as determined by hierarchical clustering. Plots are organized by site, with color and number corresponding to clonal identification of each sampling point. Similar colors and closer numbers represent shorter IBS distances. Clonal identification colors and numbers apply between plots within a site, but not across sites. Sampling points with a black border represent clones that were also found in the isolated colonies. Pie charts represent the proportion of clones that were found in either assemblage or shared on a sitewide basis, with the number of genets on each slice. There were no isolated colonies at the same site for Punta Rusia, so colonies were collected ~10 km away, and shared genets are not calculated. Gaps represent samples that were excluded due to sequencing issues. Scale bar relative to within‐plot samples, not between plots
