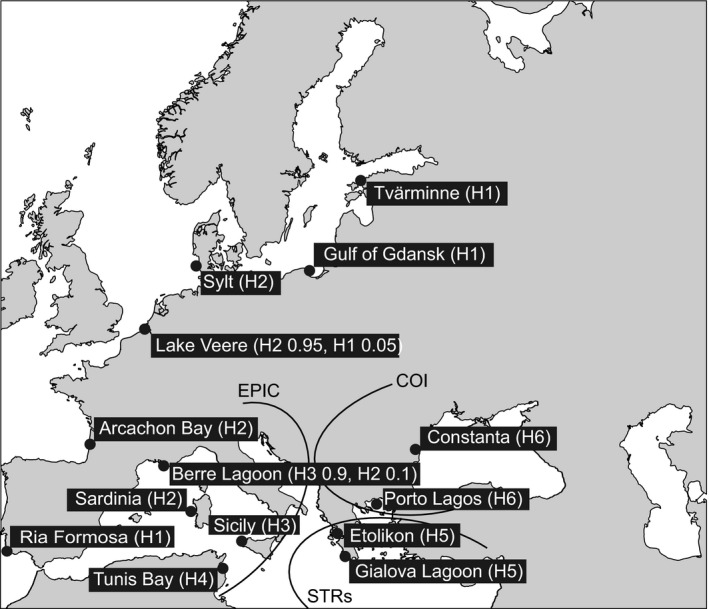
Figure 1.

Sampling site locations and the main phylogeographic breaks described in previous studies of Cerastoderma glaucum based on COI, STRs, and EPIC markers (Sromek et al., 2016; Tarnowska et al., 2010). Numbers in parentheses indicate proportion of mitochondrial DNA haplogroups (arbitrarily numbered from H1 to H6) found in each sampling site by Tarnowska et al. (2010)
