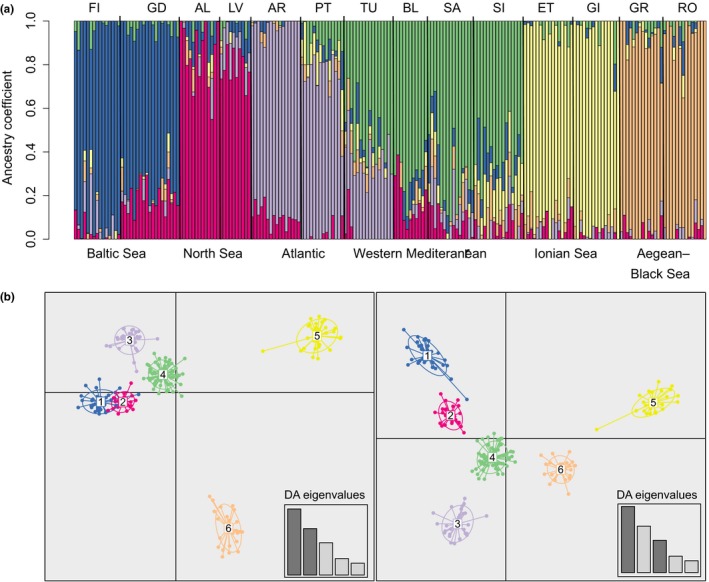
Figure 2.

Estimation of population genetic structure of Cerastoderma glaucum. Plots of posterior probabilities of group assignment of each individual based on admixture analysis (a). The color proportion for each bar represents the posterior probability of assignment of each individual to one of six clusters of genetic similarity. Subdivision of the six C. glaucum clusters according to the DAPC (b). Scatter plot of the first three components of the discriminant analysis (DA). Dots represent individuals; 95% inertia ellipses are included for each cluster
