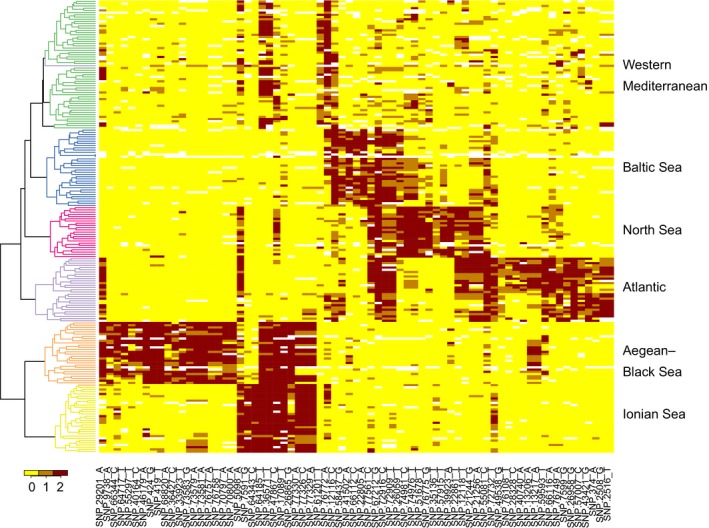
Figure 3.

Minor allele frequencies at outlier loci. Colors indicate the number of minor SNP alleles for each Cerastoderma glaucum individual at 71 outlier loci. Minor allele was defined based on the pool of all populations. The dendrogram shows the results of a hierarchical clustering based on Euclidean distances among vectors of allele frequencies
