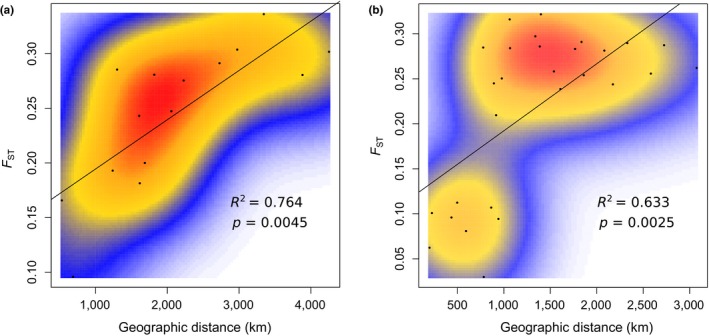
Figure 4.

Plots of the genetic distance (F ST) between Cerastoderma glaucum populations against their geographic distance: Mediterranean and Black Sea populations (a), Atlantic populations, from Portugal coast to the Baltic Sea (b). Local density of points was measured using a two‐dimensional kernel density estimation
