Figure 5.

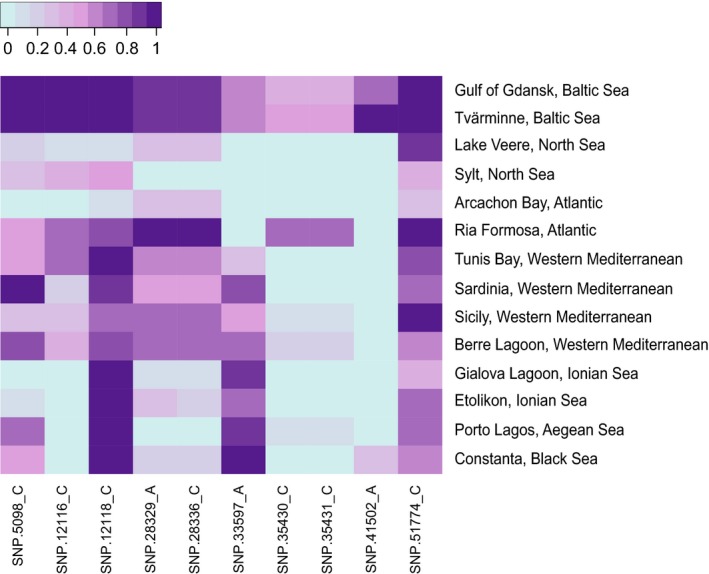
Allele frequencies at the 10 SNPs most strongly associated with mitochondrial haplogroup I and haplogroup II in Atlantic populations of Cerastoderma glaucum. See Figure 1 for geographic distribution of mtDNA haplogroups

Allele frequencies at the 10 SNPs most strongly associated with mitochondrial haplogroup I and haplogroup II in Atlantic populations of Cerastoderma glaucum. See Figure 1 for geographic distribution of mtDNA haplogroups