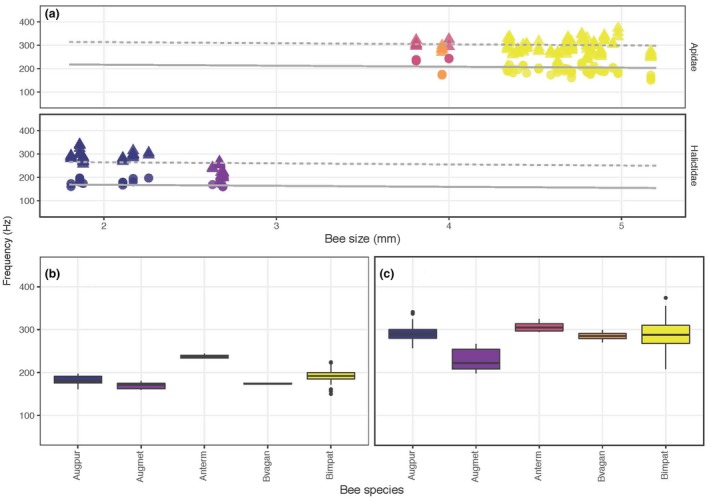
Figure 6.

(a) Relationship between fundamental frequency (cycles per second, Hz) and bee size (ITD, mm) in bees from Apidae and Halictidae visiting Solanum dulcamara (Solanaceae) in southern Ontario, Canada. Each data point corresponds to a single vibration. Circles and solid line: flight; triangles and dashed line: floral sonication. The regression lines show predicted values from the statistical model. (b, c) Boxplots of the same data grouped by bee species and vibration type (b: flight; c: floral) are arranged from smallest (Auguchlora pura, Augpur) to largest (Bombus impatiens, Bimpat)
