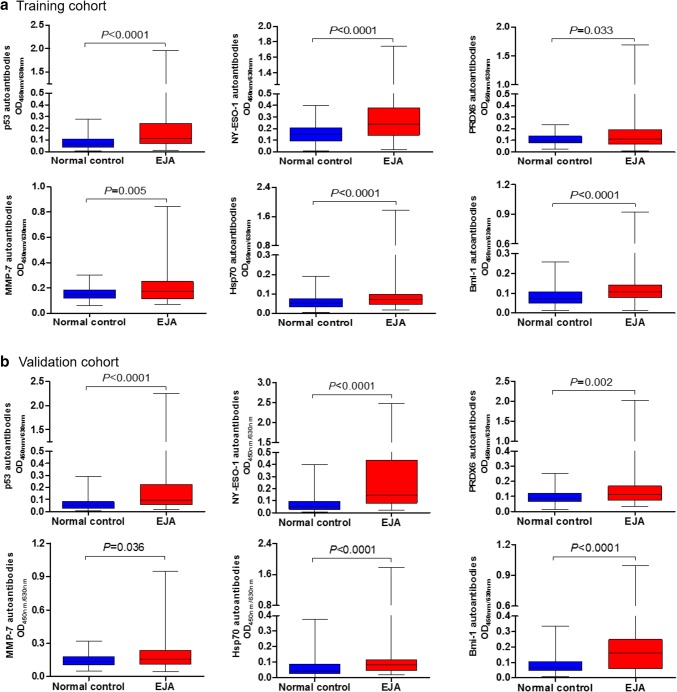
Fig. 2.
Serum autoantibody levels. Median levels and interquartile ranges of individual autoantibodies in sera of EJA patients and normal controls in the training cohort (a) and the validation cohort (b) are illustrated by box plot and the whiskers show minimum and maximum value. Mann–Whitney U test was conducted to assess differences of autoantibody levels between sera of EJA patients and normal controls. EJA esophagogastric junction adenocarcinoma

