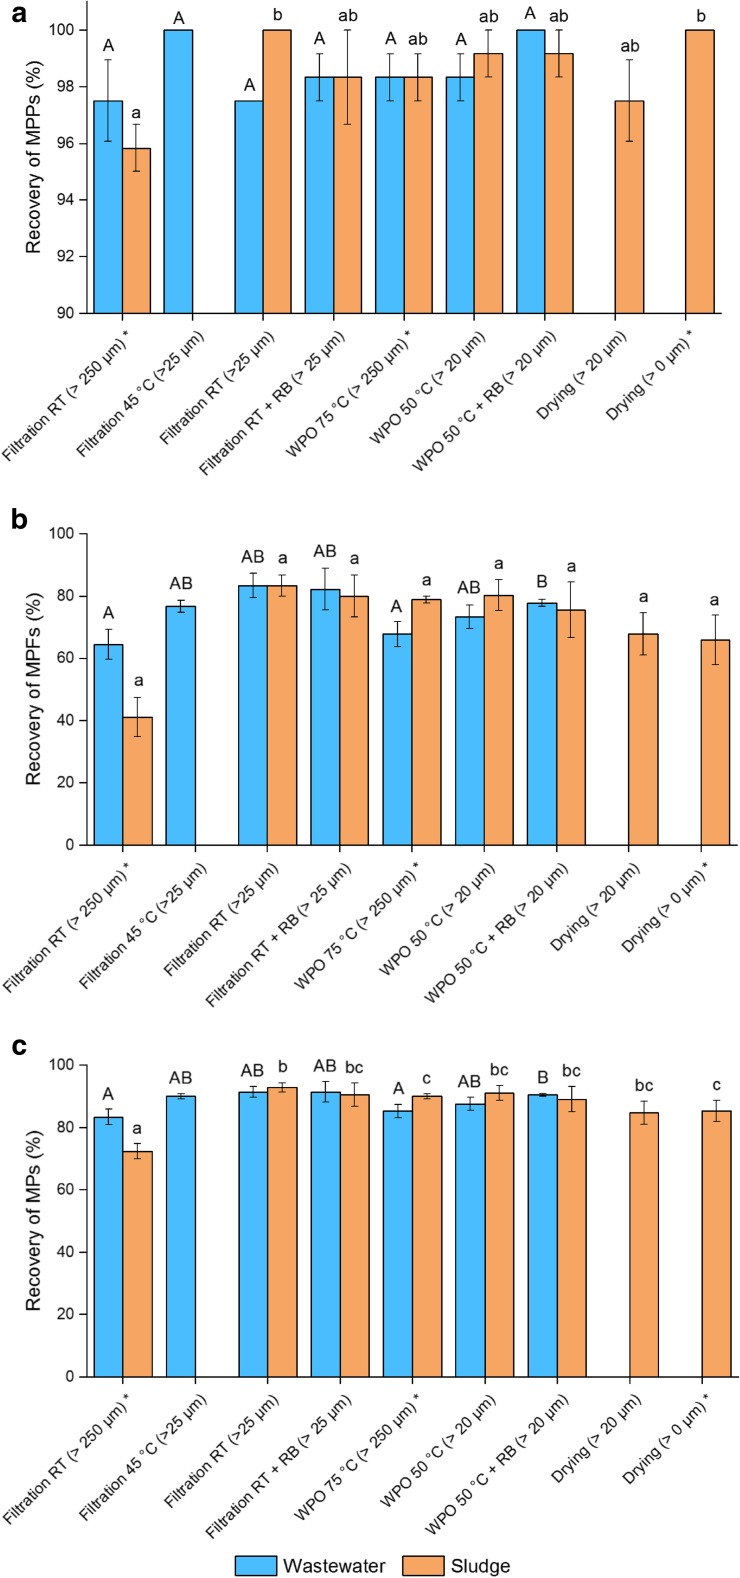
Fig. 3.
Recovery rates (± s.e.m.) of (a) MPPs, (b) MPFs and (c) total MPs for adjusted methods. Blue bars represent wastewater and orange bars digested sludge samples. Different letters over the bars indicate significant differences among methods. Results were compared only with results gained with same media (wastewater or sludge). *results from part I, RT room temperature, RB staining with Rose Bengal

