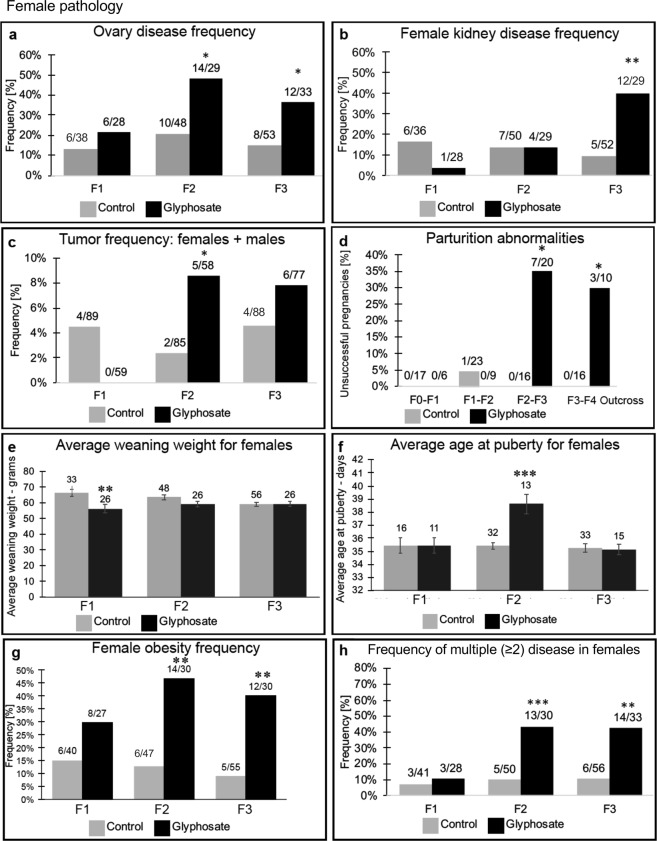
Figure 2.
Female pathology analysis in F1, F2 and F3 generation control and glyphosate linage 1-yearr old rats. (a) ovary disease frequency, (b) female kidney disease frequency, (c) tumor frequency (males and females), (d) parturition abnormalities, (e) average weaning weight for females, (f) average age of puberty for females, (g) female obesity frequency, and (h) frequency of multiple disease in females. The pathology number ratio with total animal number is listed for each bar graph or mean ± SEM (e,f), presented with asterisks indicating a statistical difference (*)p < 0.05, (**)p < 0.01, and (***)p < 0.001 in comparison with control lineage animals.

