
Figure 3.
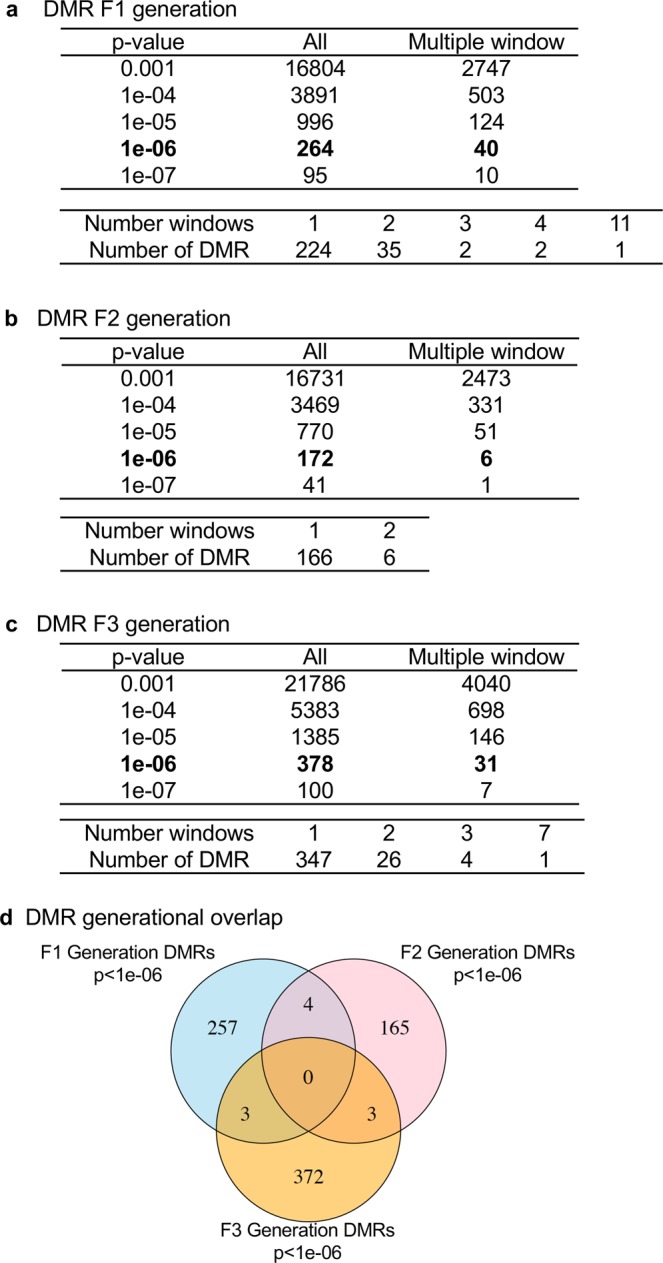
Epigenetic analysis and DMR identification. The number of DMRs found using different p-value cutoff thresholds. The All column shows all DMRs. The Multiple Window column shows the number of DMRs containing at least two significant windows. The number of DMR with each specific number of significant windows at a p-value threshold of 1e-06 is shown below each table. (a) DMR F1 Generation. (b) DMR F2 Generation. (c) DMR F3 Generation. (d) DMR overlap Venn diagram.