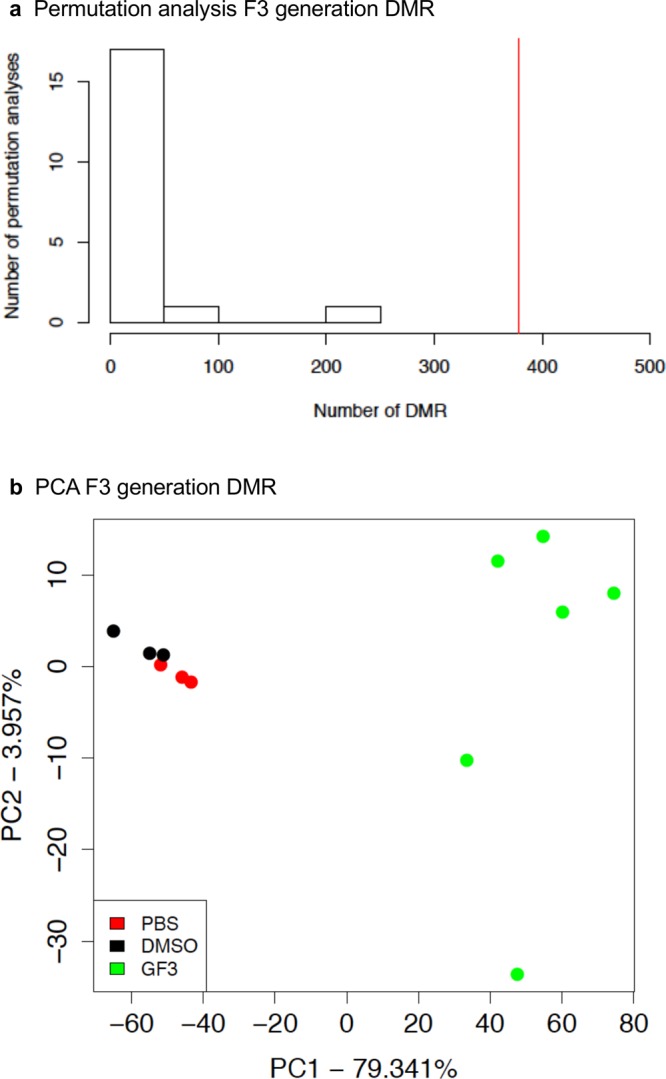
Figure 5.

Permutation and principle component DMR analysis (PCA). (a) The number of F3 generation DMR for all permutation analyses. The vertical red line shows the number of DMR found in the original analysis. All DMRs are defined using an edgeR p-value threshold of 1e-06. (b) DMR PCA using DMRs and not whole genome for F3 generation control and glyphosate DMR analysis with legend insert. The control (PBS), control (DMSO) and glyphosate F3 generation lineage (GF3) indicated.
