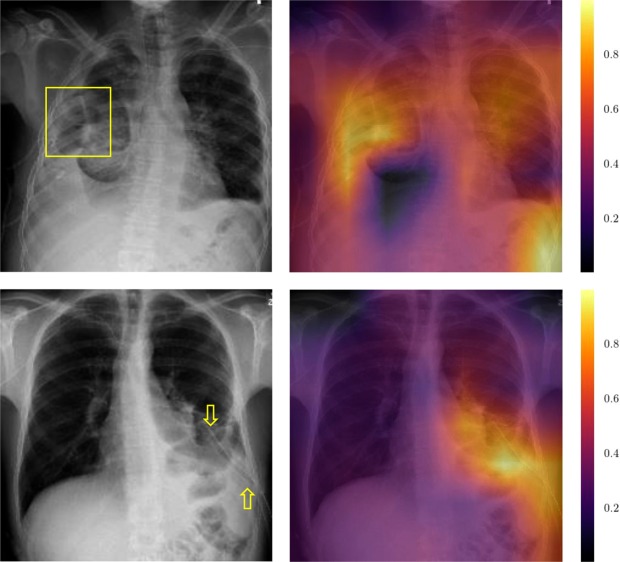
Figure 4.
Grad-CAM result for two example images. In the first one, we marked the location of the pneumothorax with a yellow box. As shown in the Grad-CAM image next to it, the models highest activation for the prediction is within the correct area. The second row shows a negative example where the highest activation, which was responsible for the final predication “pneumothorax”, is at the drain. This indicates that our trained CNN picked up drains as a main feature for “pneumothorax”. We marked the drain with yellow arrows.

