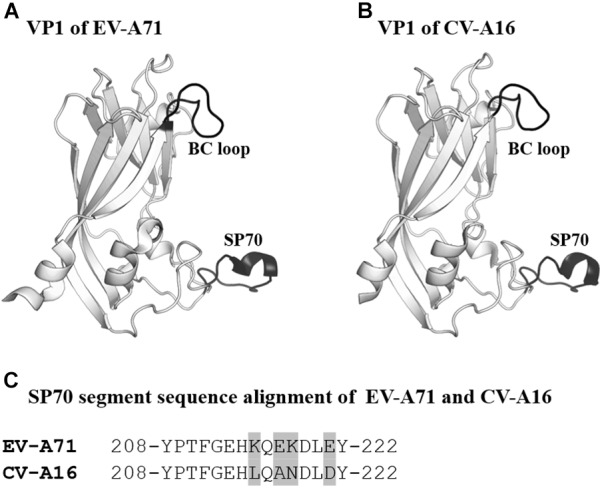
FIGURE 4.

VP1 of EV-A71 and CV-A16. (A,B) Cartoon representation of VP1 (amino acids 76–276) of EV-A71 (PDB ID: 3VBS) and CV-A16 (PDB ID: 5C4W). The BC loop and SP70 region are shown in black and labeled. (C) Sequence alignment of SP70 segments of EV-A71 and CV-A16. Amino acids that are not conserved between the two viruses are highlighted in light gray.
