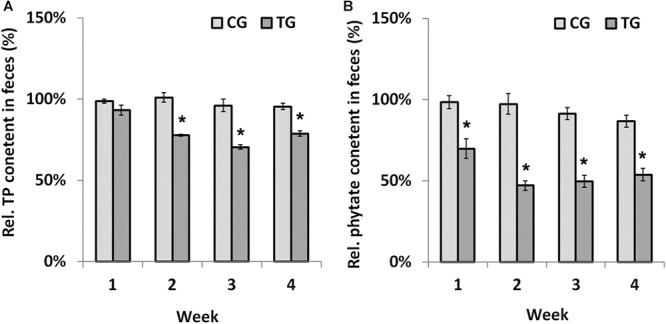
Figure 4.

Phytate degradation by B. longum JCM 1217/pBPES-tu in chicks. (A) relative TP contents in the feces of chicks collected from different groups at each weekend; (B) relative remnant phytate in the feces of chicks collected from different groups at each weekend. Data are mean ± SD of three samples collected from three cages relative to the corresponding contents in NG group. Statistical analysis was performed using one-way ANOVA with Bonferroni post-test (∗significant with P < 0.01). NG, non-treat group; CG, control group; TG, test group.
