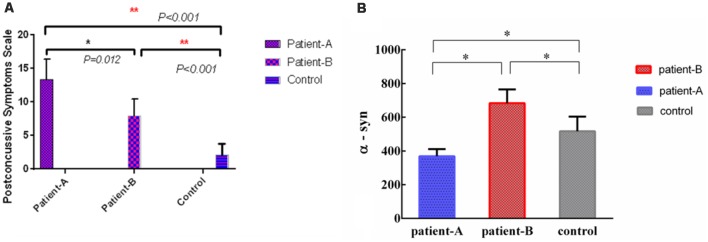
Figure 2.
The levels of serum α-syn of Patient-A was significantly different with Patient-B (p = 0.012) and controls (p < 0.001), meanwhile, the levels of serum α-syn of Patient-B was significantly different with controls (p < 0.001; A). The levels of serum α-syn in Patient-A were significantly different compared with Patient-B (p < 0.001), the levels of serum α-syn in controls were also significantly different compare with Patient-A (p < 0.001) and Patient-B (p < 0.001; B). *p < 0.05, **p < 0.001.

