Figure 3.

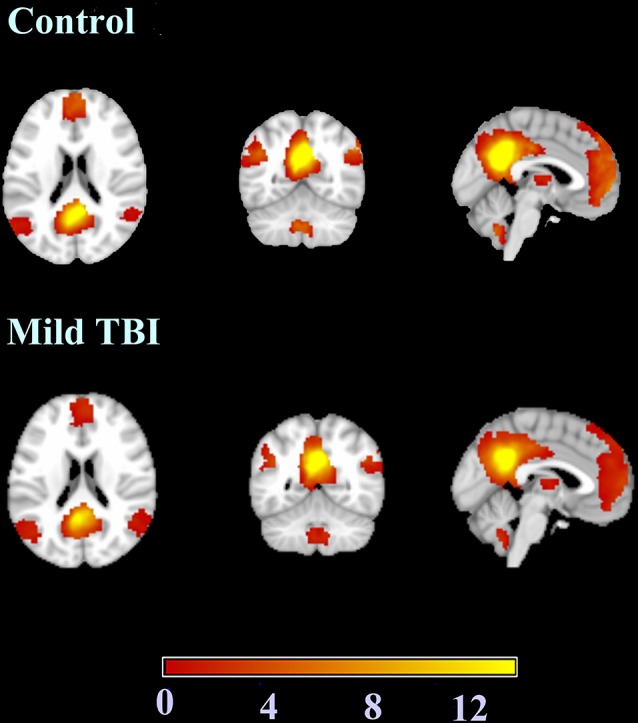
The results of the one-sample t-test used to identify brain regions within the default mode network (DMN) mask with functional connectivity differences.

The results of the one-sample t-test used to identify brain regions within the default mode network (DMN) mask with functional connectivity differences.