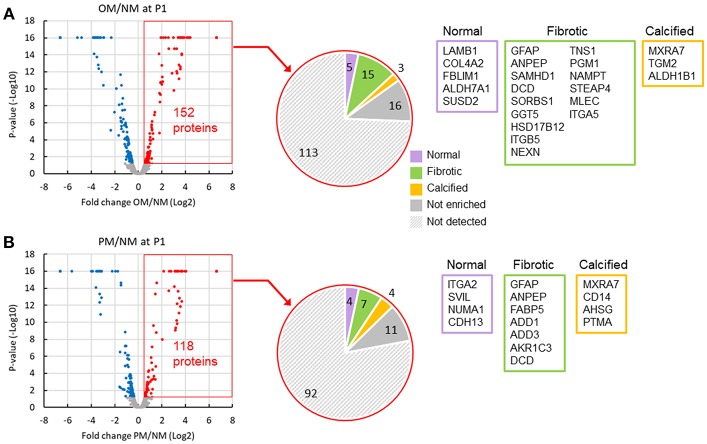
Figure 4.
Comparison of VIC and valve tissue proteomics datasets indicated some shared regulated proteins. Volcano plots of increased (red) and decreased (blue) passage one VIC proteins in OM (A) and PM (B) after 2 weeks in culture. Comparison of increased VIC proteins (152 in OM and 118 in PM) to valve tissue disease stage proteomics dataset shown in pie charts. List of gene names for proteins increased in OM or PM, which were also found to be enriched in normal (purple box), fibrotic (green box), and calcified (orange box) human aortic valve tissues. Not enriched indicates proteins increased in VICs that were not found to be enriched in any of the three valve tissue disease stages. Not detected indicates proteins not detected in the untargeted valve tissue proteomics dataset; n = 4 VIC donors and 9 human valve tissue donors.

