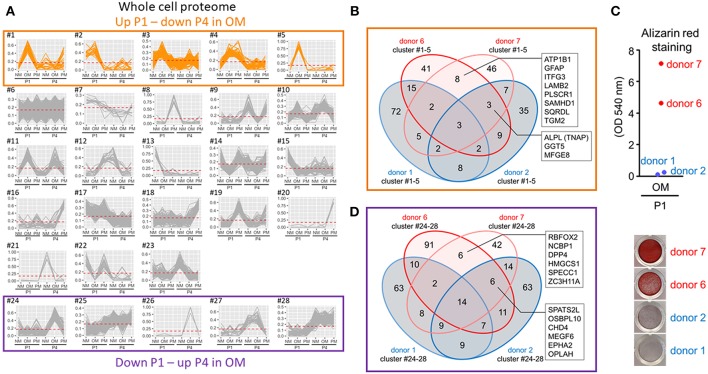
Figure 5.
Valvular interstitial cell whole cell proteomics identified TNAP as a regulator of donor- and passage-dependent calcification in OM. (A) XINA clustering analysis of protein abundances in NM, OM, and PM. Clusters with increased protein abundance at passage one (P1) and decreased abundance at passage four (P4) in OM indicated in orange (clusters #1–5). Clusters with decreased protein abundance at P1 and increased abundance at P4 in OM indicated by purple box (clusters #24–28); n = 4 donors. (B) Venn diagram showing total number of proteins detected for the four donors analyzed (donors 1, 2, 6, 7) and found in the five identified clusters in which abundance was increased at P1 and decreased at P4 in OM. Calcification-prone donors (calcified at P1 in OM; donors 6 and 7) indicated by red color, and calcification-resistant donors (did not calcify at P1 in OM; donors 1 and 2) indicated by blue color. Proteins detected in the five clusters of the two calcification-prone but not in the calcification-resistant donors indicated: sodium/potassium-transporting ATPase subunit beta-1 (ATP1B1), glial fibrillary acidic protein (GFAP), family with sequence similarity 234 member A (ITFG3), laminin subunit beta 2 (LAMB2), phospholipid scramblase 1 (PLSCR1), SAM, and HD domain containing deoxynucleoside triphosphate triphosphohydrolase 1 (SAMHD1), sulfide:quinone oxidoreductase (SQRDL), and transglutaminase 2 (TGM2). Proteins detected in the five clusters in the two calcifying donors and one of the two non-calcifying donors indicated: tissue non-specific alkaline phosphatase activity (TNAP), gamma-glutamyltransferase 5 (GGT5), milk fat globule-EGF 8 (MFGE8). (C) Alizarin red staining at P1 for the four donors used in proteomics analysis (data also included, in part, in Figure 1B). (D) Venn diagram showing total number of proteins detected for the four donors analyzed (donors 1, 2, 6, 7) and found in the five identified clusters in which abundance was decreased at P1 and increased at P4 in OM.

