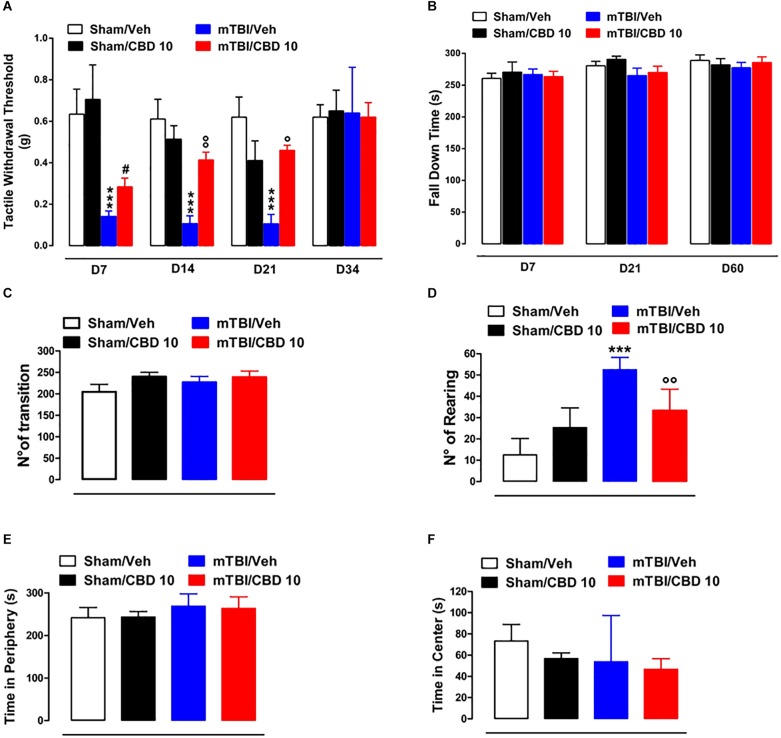
FIGURE 3.
Effect of CBD on behavioral evaluations in sham and mTBI mice. (A) Shows Tactile withdrawal thresholds (TWT) measured through Von Frey monofilaments, (B) shows the latency to fall in the rotarod test, (C–F) show the number of transitions, number of rearing, the time spent in the periphery or in the center, in the open field test, respectively. Data are represented as mean ± SEM of 10–11 mice per group. ∗, # and ° indicate significant differences compared to sham/vehicle, sham/CBD 10 or TBI/vehicle, respectively. P < 0.05 was considered statistically significant. One-way ANOVA, followed by Bonferroni’s Multiple Comparison post hoc tests.

