
FIGURE 2.
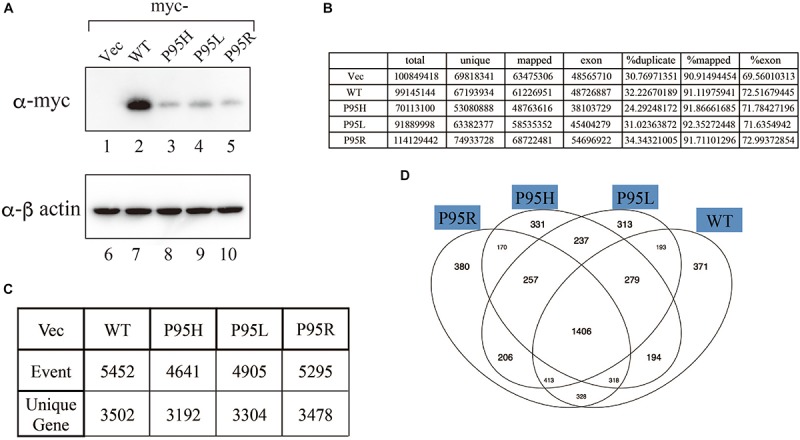
Analyses of splicing changes in K562 cells stably expressing either wild-type or mutant SRSF2 protein. (A) Immunoblotting analyses of K562 cell lines stably expressing myc-tagged wild-type or mutant SRSF2 proteins. A myc-vector was used as a negative control. (B) Numbers of reads from RNA sequence analyses and mapping percentage of sequence tags. (C) Numbers of altered splicing events and genes identified by comparing with myc-vector transfected cells. (D) Venn diagram comparing the differentially spliced genes among myc-vector, WT and three SRSF2 mutants expressing cells.