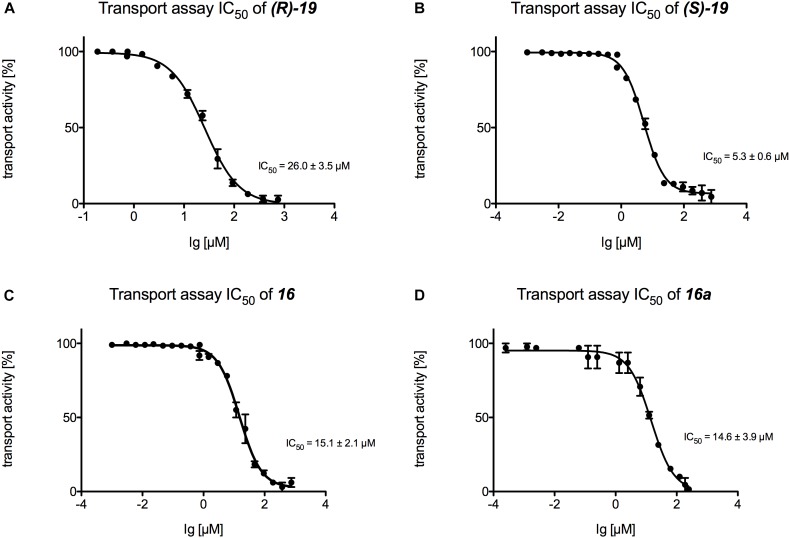
FIGURE 6.
Determination of the transport IC50 values for (A) compound (R)-19, (B) compound (S)-19, (C) compound 16 and (D) compound 16a. For each compound a serial dilution was used to determine the IC50 curve. Membranes were incubated with the compound and active transport was detected with the Tecan Infinite M200.

