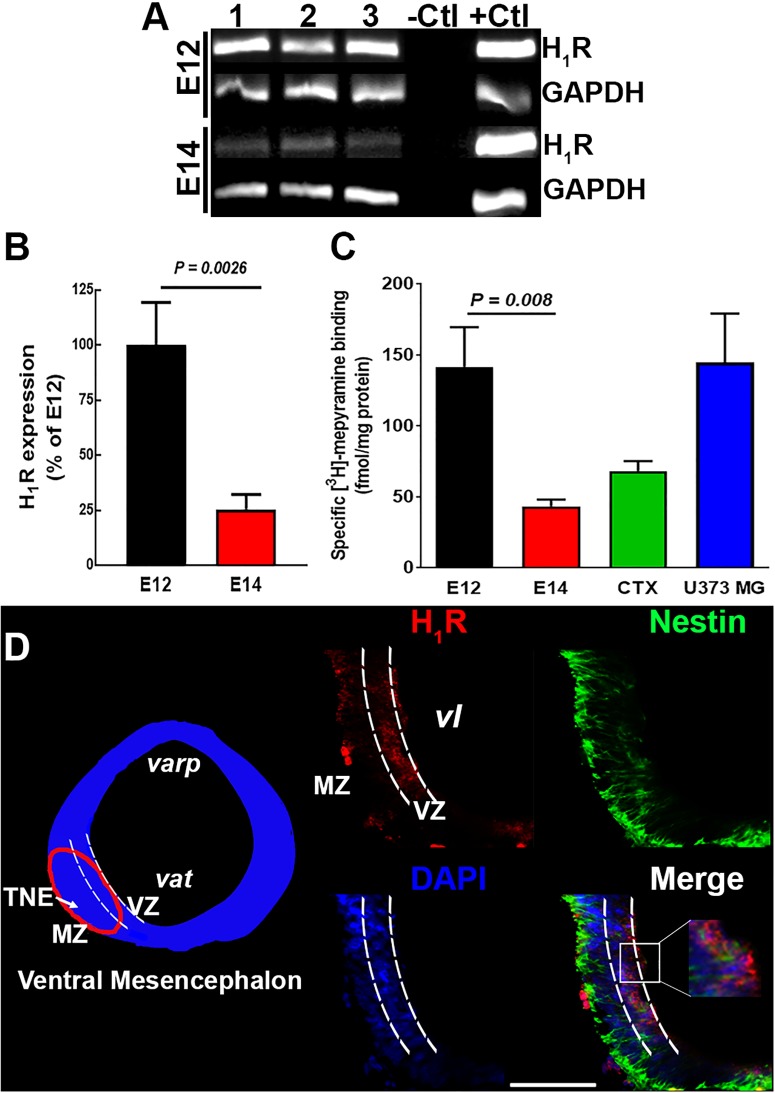
FIGURE 2.
H1R expression in the ventral mesencephalon of 12- and 14-day-old embryos. (A) Representative agarose gels of the PCR products for H1R and GAPDH (internal control) from control E12 and E14 vMes tissue. –Ctl, negative control (500 ng total RNA without retrotranscription); +Ctl, positive control (500 ng cDNA from adult cerebral cortex). (B) Semi-quantitative densitometry analysis for H1R expression at E12 and E14. Values are expressed as percentage of the optic densities obtained at E12 and are means ± standard error (SEM) from eight experiments. (C) Specific [3H]-mepyramine binding to membranes. Values are expressed as fmol/mg protein, and are means ± SEM from five experiments. Membranes from adult cerebral cortex and human astrocytoma U373 MG cells were used as positive controls. P-values were obtained after two-tailed unpaired Student’s t-test. (D) H1R immunodetection. Left, coronal view of the mesencephalon at E12. The area outlined in red corresponds to the area shown in the representative epifluorescence micrographs (20×) on the right, which show independent and merged channels for H1Rs (red), Nestin (green), and DAPI (blue). MZ, marginal zone; VZ, ventricular zone; TNE, tegmental neuroepithelium; varp, aqueduct pretectal; vat, aqueduct tegmental; vl, ventricular lumen. Scale bar, 100 μm.

