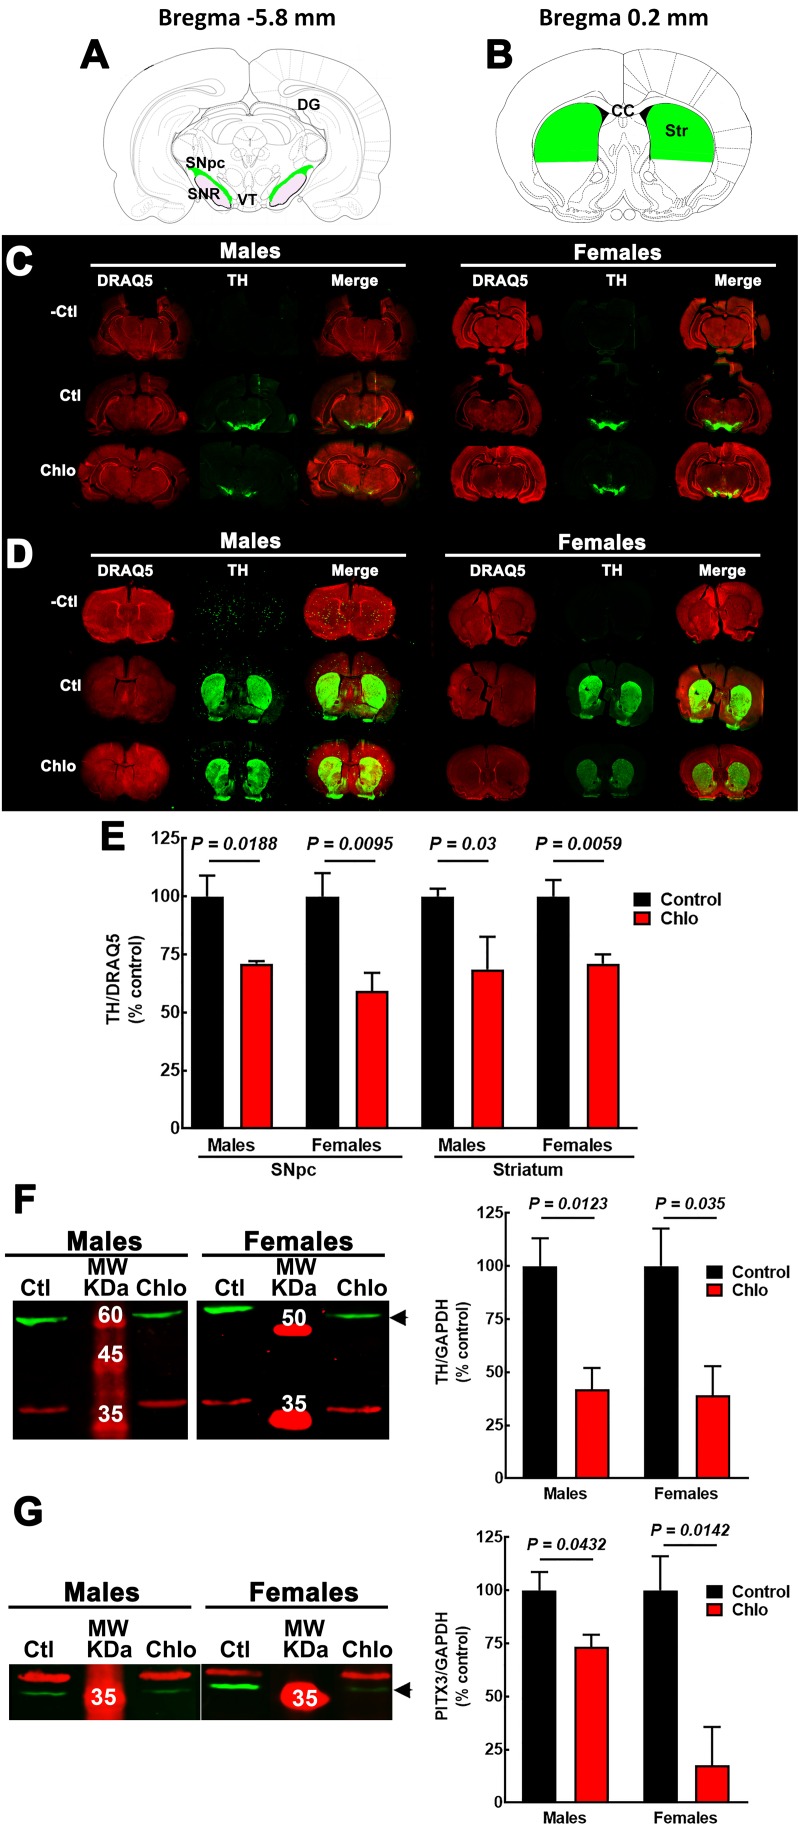
FIGURE 6.
Effect of chlorpheniramine administration to pregnant rats on tyrosine hydroxylase (TH) immunoreactivity and protein levels in the substantia nigra and striatum from 21-day-old offsprings. (A,B) Cartoons of coronals sections at Bregma –5.8 and 0.2 mm. The areas in green were the anatomical region determined for TH immunoreactivity quantification in substantia nigra pars compacta (A, SNpc) and striatum (B, Str). Modify from Paxinos and Watson. (C,D) Representative images for TH immunoreactivity in brain coronal sections containing the SNpc (C) and the striatum (D) from 21-day-old male and female offsprings of control and chlorpheniramine-treated (Chlo) rats. Single and merged channels for the internal control DRAQ5 (red, nuclei) and TH (green) are shown. –Ctl, negative control (incubation without the primary antibody); Ctl, control, and Chlo, chlorpheniramine. (E) Quantitative analysis of TH immunoreactivity in SNpc and striatum of the offsprings from control and chlorpheniramine-treated (Chlo) rats. Values are expressed as percentage of the fluorescence ratio of the control tissues and are means ± SEM from four experiments. (F,G) Left, representative Western blots for the SNpc of male and female P21 offsprings from control (Ctl) and Chlo rats. The green band corresponds to TH (60 kDa) in panel (F) and to PITX3 (32 kDa) in panel (G). For both panels, the red band corresponds to the internal control (GAPDH, 37 kDa). MW, molecular weight ladder (kDa). Right, quantitative fluorometry analysis of TH and PITX3. Values are expressed as percentage of the fluorescence ratio of the control tissues and are means ± SEM from four experiments. P-values were obtained after two-tailed unpaired Student’s t-test; n.s., non-significant.

