
Figure 4.
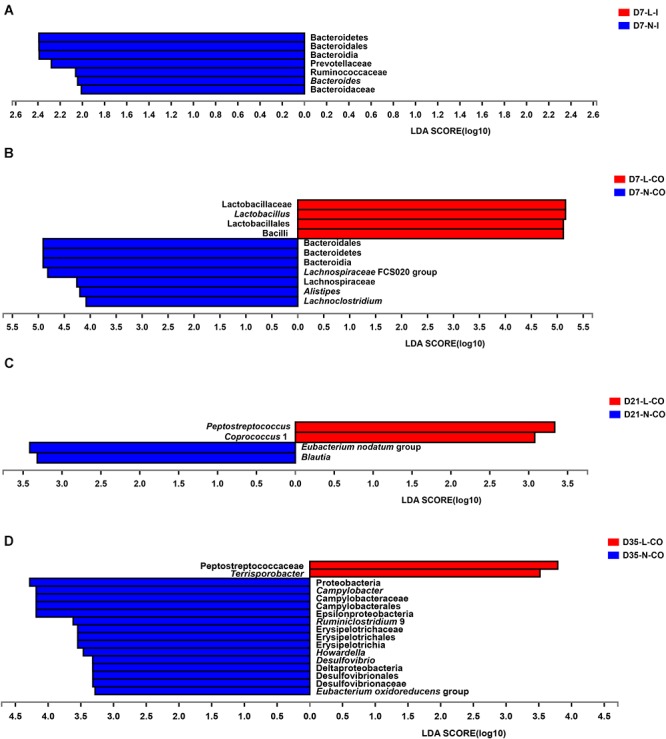
Differentially abundant taxa between LBW and NBW piglets. Histograms of a linear discriminant analysis (LDA) score (threshold: ≥ 2) in ileal samples on D7 (A), colonic samples on D7 (B), colonic samples on D21 (C), and colonic samples on D35 (D) are plotted. n = 6 per group. L, low birth weight; N, normal birth weight; I, ileum; CO, colon.