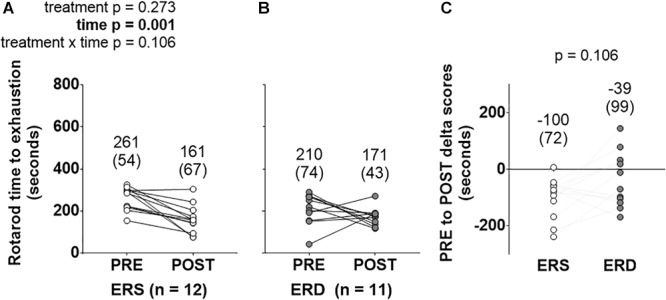
Figure 1.

Rotarod performance between treatments over time. These data show rotarod performance prior to (PRE) and following (POST) the 28-day feeding intervention in ERS (A) and ERD (B). (C) Shows PRE to POST delta scores. Notably, only a significant main effect of time was observed. Group mean ± parenthesized standard deviation values are presented above all data points. ERS, EVs and RNA-sufficient; ERD, EVs and RNA-depleted.
