
Figure 2.
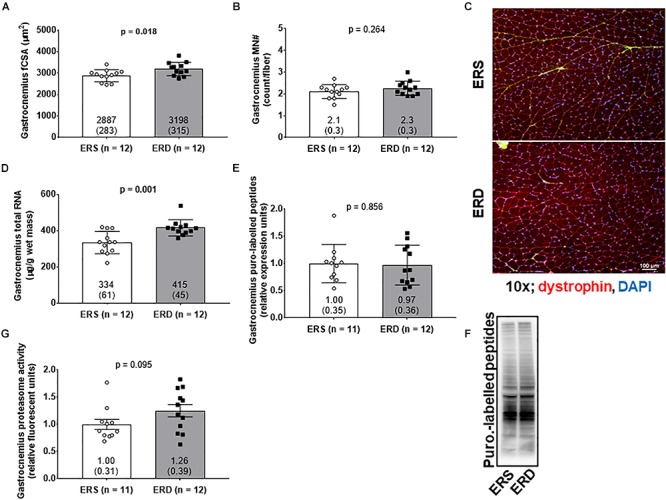
Markers of anabolism between treatments. These data show gastrocnemius muscle fiber cross-sectional area (fCSA) (A), myonuclear number (MN#) (B), total RNA indicative of ribosomal density (D), puromycin-labeled peptides indicative of relative muscle protein synthesis (MPS) levels (E), and proteasome activity (G). (C) contains a 10x representative objective from each group, and (F) contains a representative puromycin Western blot. Group mean ± parenthesized standard deviation values are presented, and individual values are also presented. ERS, EVs and RNA-sufficient; ERD, EVs and RNA-depleted.