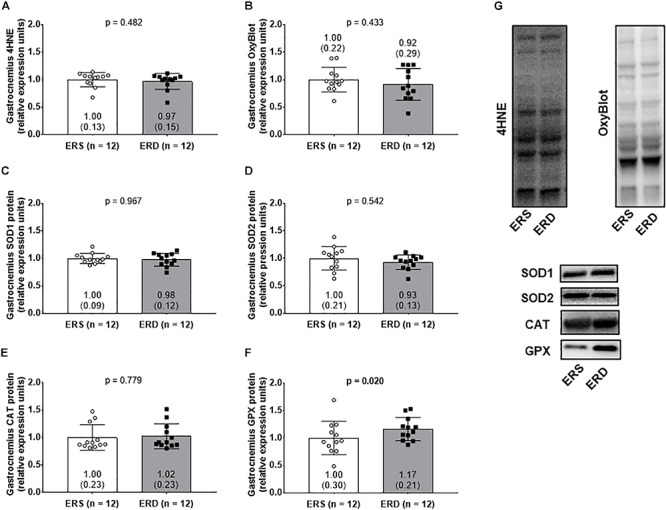
Figure 5.

Antioxidant and oxidative damage markers between treatments. Gastrocnemius 4-hydroxynonenal (4HNE) levels (A), protein carbonyl levels determined via the OxyBlot method (B), superoxide dismutase 1 (SOD1) protein levels (C), superoxide dismutase 2 (SOD2) protein levels (D), catalase (CAT) protein levels (E), and glutathione peroxidase (GPX) protein levels (F). (G) Contains representative Western blots for each target. Group mean ± parenthesized standard deviation values are presented, and individual values are also presented. ERS, EVs and RNA-sufficient; ERD, EVs and RNA-depleted.
