
Figure 3.
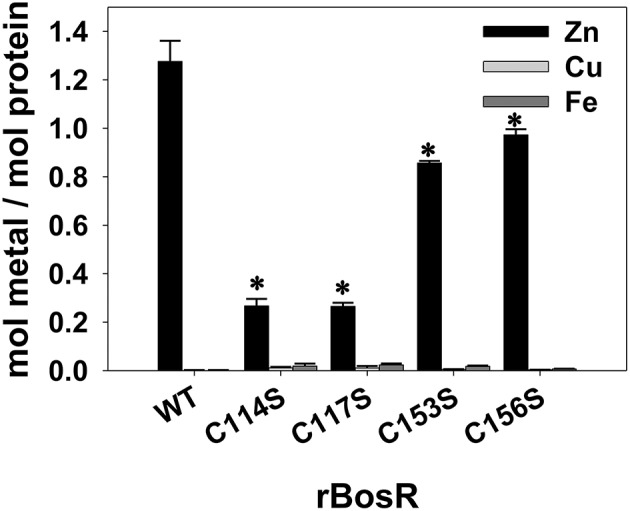
Metal content analysis of the recombinant BosR and variants. Proteins from at least three independent FPLC purifications were used for analyses. Protein concentration was determined by using the BCA protein assay. Metal content was determined by ICP-AES as detailed in Materials and Methods. Data are presented as the mean values ± standard deviations. The asterisk denotes statistical significance using Student's t test (P <0.05) when compared with WT rBosR. The graph shows only the values of Zn, Cu, and Fe, and the concentrations of Mn, Cr, Cd, Ni, Mg, and Pb are below the detection limit.