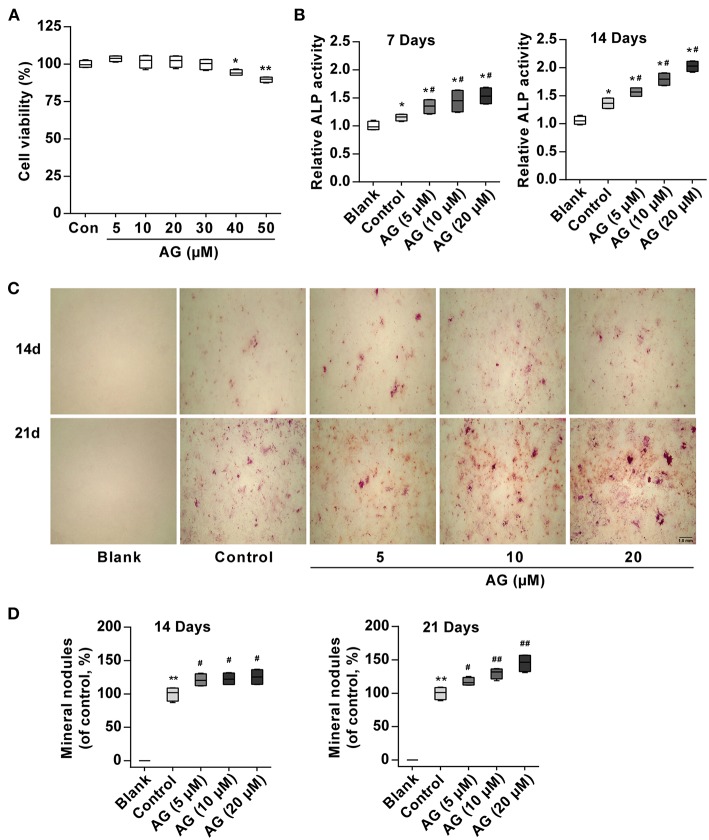
Figure 1.
The effects of AG on osteoblastic differentiation and matrix mineralization in mouse MC3T3-E1 cells. (A) Viability of MC3T3-E1 cells was measured by MTT assay after 48 h of AG treatment. *P < 0.05, **P < 0.01 compared with the control group. N = 4. (B) ALP activity was determined by using the Alkaline Phosphatase Assay Kit after 7 and 14 days of AG treatment. *P < 0.05 compared with the corresponding blank group. #P < 0.05 compared with the corresponding control group. N = 4. (C) Representative images of mineralized nodules after Alizarin Red S staining. Scale bar, 1.0 mm. (D) Quantitative analysis of mineralized nodules after Alizarin Red S staining. *P < 0.05 compared with the corresponding blank group. #P < 0.05, ##P < 0.01 compared with the corresponding control group. N = 4. All of the data are shown as the mean ± S.D. of the independent experiments.

