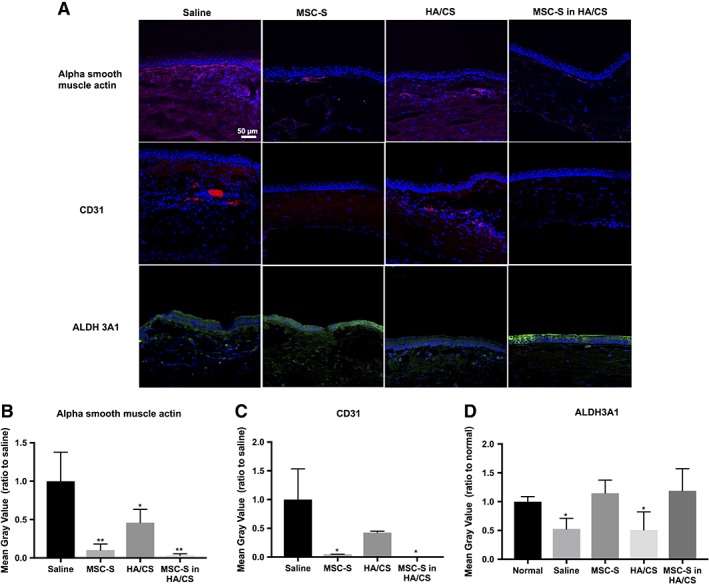
Figure 5.

(A): Immunofluorescence images of rat cornea sections 14 days after treatment with saline, MSC‐S, HA/CS, and MSC‐S in HA/CS—scale bar 50 μm. Alpha smooth muscle actin and CD31 staining were greater in the HA/CS and saline groups compared to both MSC‐S‐containing groups (with and without the HA/CS carrier). Expression of Aldehyde Dehydrogenase 3 Family Member A1 (ALDH3A1) was maintained for both group containing MSC‐S. Decreased ALDH3A1 expression was observed in the corneas that received saline and HA/CS. (B): Quantification of the fluorescence intensities using ImageJ revealed that the alpha smooth muscle actin expression was significantly lower in all treatment groups compared the saline group, and lower in the MSC‐S‐containing groups compared to the HA/CS group, while (C): CD31 expression was significantly lower in the MSC‐S‐containing groups compared to the saline group, and (D): ALDH3A1 expression was similar to normal corneas in MSC‐S containing groups but was significantly lower in the HA/CS and saline groups (*, p < .05; **, p < .01). Abbreviations: CS, chondroitin sulfate; HA, hyaluronic acid; MSC‐S, mesenchymal stem cells secretome.
