FIGURE 5.
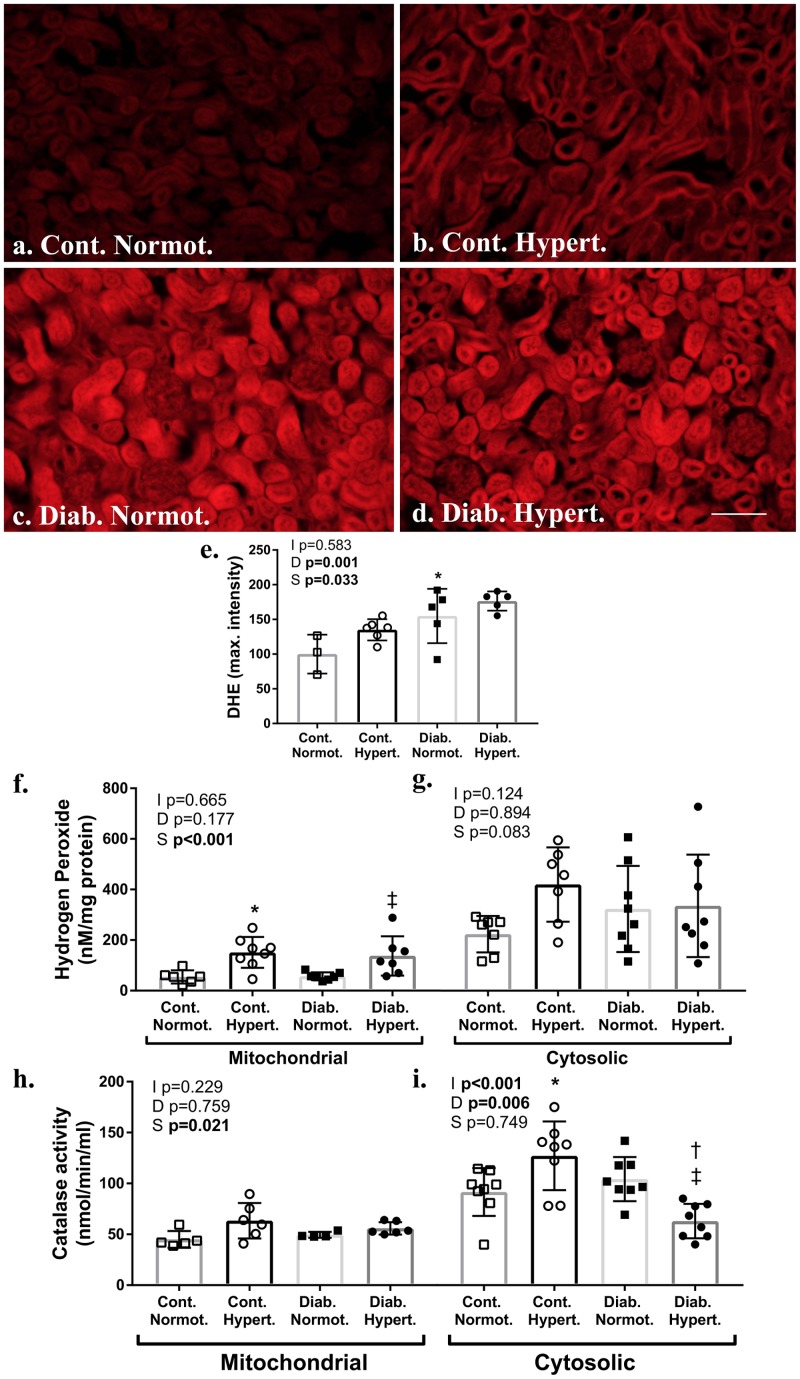
Measures of renal cortical oxidant and anti-oxidant systems. Assessment of frozen sections for superoxide by dihydroethidium (DHE; a–e) found significantly greater fluorescence intensity in diabetic animals relative to non-diabetic control hypertensive mice (e). Assessment of renal cortical cytosolic and mitochondrial fractions for hydrogen peroxide production (f,g) found hypertensive animals had significantly greater mitochondrial levels irrespective of diabetic status. Catalase activity (h,i) was significantly greater in the cortical mitochondrial and cytosolic fraction of diabetic normotensive animals as compared to non-diabetic normotensive mice. The cytosolic fraction of diabetic hypertensive mice had significantly less catalase activity than diabetic normotensive mice. DHE n = 5–6/group except control normotensive n = 3; Hydrogen peroxide production and catalase activity n = 6-8/group. Normot. Cont- non-diabetic control; Diab., diabetic; Normot., normotensive BPN/3J mice; Hypert., hypertensive BPH/2J mice. 2-way ANOVA p-values: I, interaction; D, relative to diabetic status; S, relative to strain. t-test p < 0.05: ∗ vs. Cont. Normot.; † vs. Cont. Hypert.; ‡ vs. Diab. Normot.; DHE Cont. Hypert. vs. Diab. Hypert. p = 0.07. Scale bar: 100 μm.

