
FIGURE 6.
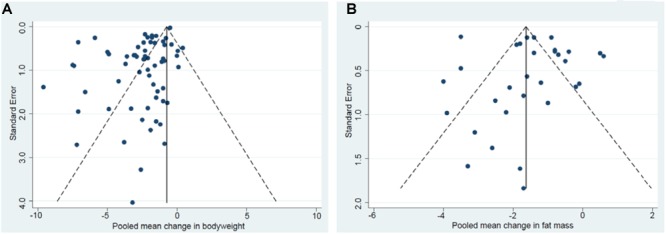
Begg’s funnel plot of changes in bodyweight (A). Begg’s funnel plot of changes in fat mass (B).
Official websites use .gov
A
.gov website belongs to an official
government organization in the United States.
Secure .gov websites use HTTPS
A lock (
) or https:// means you've safely
connected to the .gov website. Share sensitive
information only on official, secure websites.
Begg’s funnel plot of changes in bodyweight (A). Begg’s funnel plot of changes in fat mass (B).