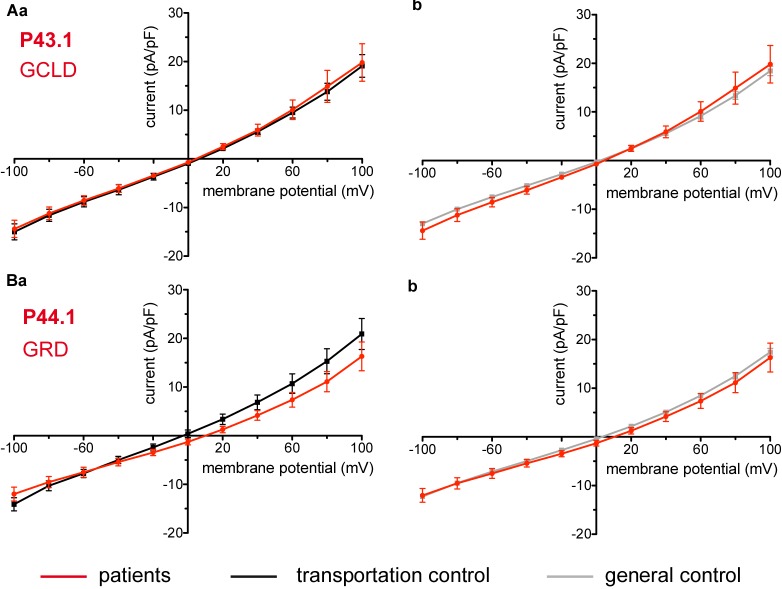
FIGURE 10.
Whole-cell recordings of ion currents from RBCs of healthy donors and patients with enzymopathies. Compared are the I/V curves of P43.1 (GCLD below the patient number stands for glutamate-cysteine ligase deficiency) (n = 6) with its own transportation control C43 (n = 5) (Aa) as well as with a general control (n = 175) (Ab). No changes were observed in capacitance either with the transportation (0.64 pA/pF P43.1 vs. 0.65 pA/pF C43; p > 0.05) or with the general control (0.64 pA/pF P43.1 vs. 0.69 pA/pF general control; p > 0.05). Compared are the I/V curves of P44.1 (GRD below the patient number stands for glutathione reductase deficiency) (n = 9) with its own transportation control C44 (n = 5) (Ba) as well as with a general control (n = 175) (Bb), where n denotes the number of cells. No changes were observed in capacitance either with the transportation (0.76 pA/pF P44.1 vs. 0.65pA/pF C44; p > 0.05) or with the general control (0.76 pA/pF P44.1 vs. 0.69 pA/pF general control; p > 0.05). Currents were elicited by voltage steps from -100 to 100 mV for 500 ms in 20 mV increments at Vh = -30 mV. Data are expressed as mean current density ± SEMs.

