Figure 1.
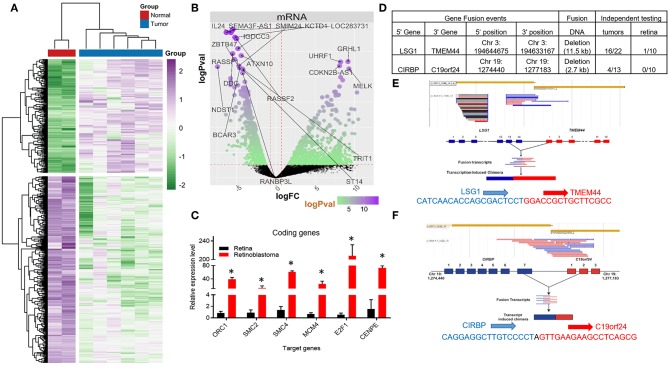
Coding RNA changes and RNA fusion products in Retinoblastoma tumors. (A) Heat map of transcriptional changes in Retinoblastoma tumors and normal retinal samples. (B) Volcano plot of the log fold change (logFC) (x-axis) and the log p-value (logPval) (y-axis) of the coding (mRNA) RNA changes in tumors and normal tissue. (C) RT-PCR Relative expression of Six E2F targets genes (ORC1, SMC2, SMC4, MCM4, E2F1, and CENPE) from four control retinal tissues and three Retinoblastoma tumors from an independent cohort (*p < 0.05). (D) Table detailing the RNA fusion products detected in the RNA-seq data, including independent testing in Retinoblastoma primary tumors and control retinal samples. (E) Screenshot and sequencing data of the LSG1 and TMEM44 fusion RNA detected in Retinoblastoma tumors. (F) Screenshot and sequencing data of the CIRBP and C19orf24 fusion RNA detected in Retinoblastoma tumors.

