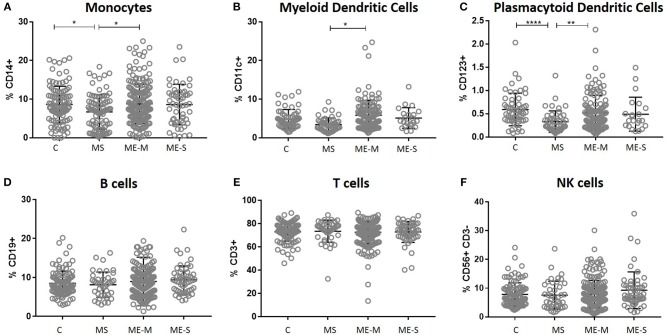
Figure 2.
Leucocyte populations in peripheral blood from people with ME/CFS, people with MS and healthy controls. PBMC were analysed by flow cytometry, as described in Figure 1. The proportions of PBMC which were (A) monocytes, (B) myeloid dendritic cells, (C) plasmacytoid dendritic cells, (D) B cells, (E) T cells or (F) NK cells were calculated and shown for individual study participants. The bars show the Mean ± SD. Data are from healthy controls (C, n = 107), multiple sclerosis (MS: n = 46), mild/moderate ME/CFS (ME-M: n = 197), and severely affected ME/CFS (ME-S: n = 54) for (A,D–F) and from C (n = 56), MS (n = 46), ME-M (n = 120), and ME-S (n = 21) for (B,C). Clinical groups were compared by Kruskal-Wallis test for non-parametric data: *P < 0.05, **P < 0.01, ****P < 0.0001.

