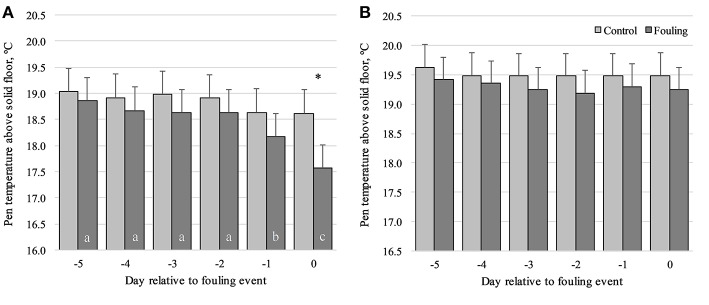
Figure 3.
Pen temperature above the solid floor from day-5 to day0 relative to an event of fouling in pens with no straw provided (A) and in pens provided daily with 150 g of straw per pig on the solid floor (B) divided between control and fouling pens. *P < 0.05 indicates differences between control and fouling pens. Difference in lower case letters (a, b, c) indicates differences between observation days within each pen type (control and fouling).

