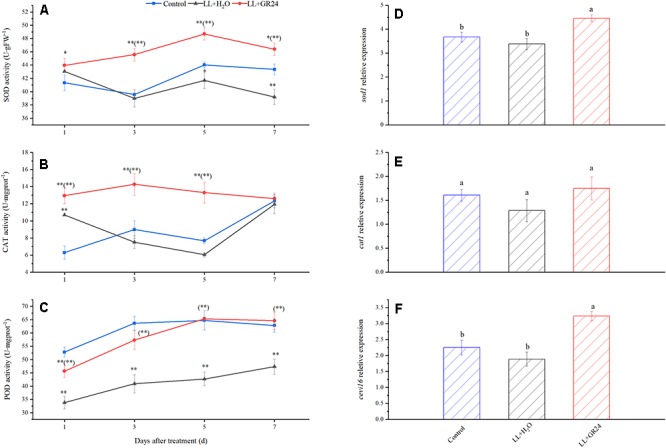
Figure 7.

Effects of exogenous GR24 on the activity of SOD (A), CAT (B), POD (C), and the transcript level of sod1 (D), cat1 (E), and cevi16 (F) in tomato leaves under LL stress. The transcript level shown in the figure are from the 7th day of treatment. ∗ and ∗∗ indicate statistically significant differences at P ≤ 0.05 and P ≤ 0.01, respectively. Multiple comparisons between the figures among the treatments under LL are shown in parentheses. Lowercase letters represent significant differences difference between treatments at P ≤ 0.05 by the LSD test.
