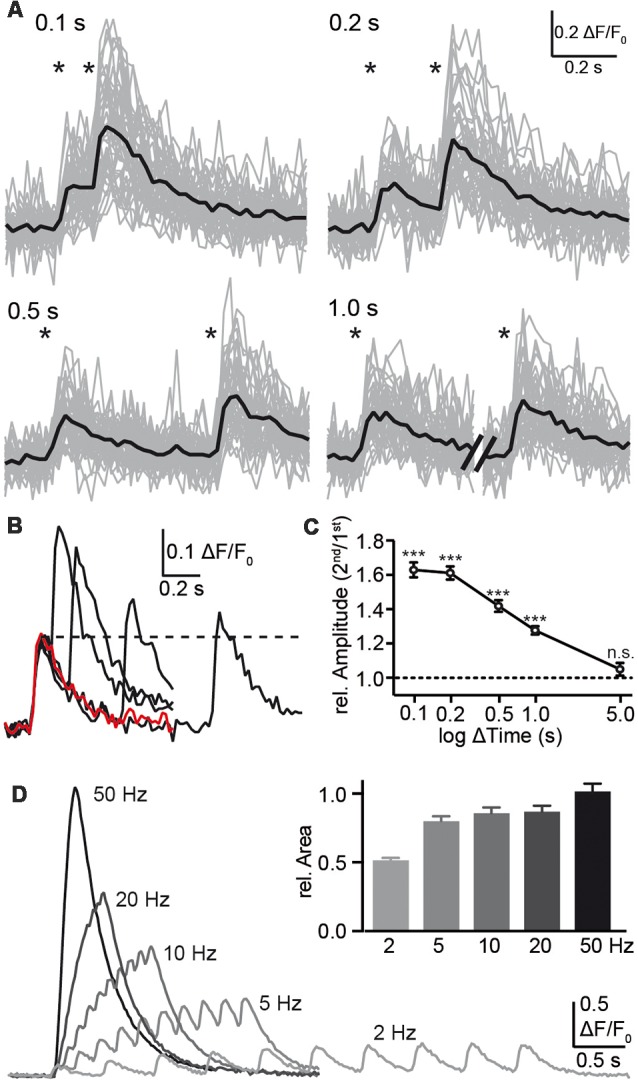
Figure 4.

Analysis of paired-pulse facilitation (PPF) using synGCaMP6f. (A) Pairs of single AP stimulations with intervals between 0.1 and 1.0 s as indicated by asterisks induced an enhancement amplitude in Ca2+ transients following the second AP. Sample recordings show the strongest enhancement with the shortest possible interval at 0.1 s. Black traces, averaged responses from 47 ROIs. (B) The overlay of the averaged responses (black traces from the recordings in (A) are compared to the response to a single AP (red trace) of the same neuron. The dotted line indicates the amplitude maximum of the first calcium transient for comparison. (C) Summary of presynaptic paired-pulse ratios determined from calcium transients of 29 neurons shows a long-lasting facilitation of the presynaptic calcium response with significant amplification even at 1 s interval. For the shorter intervals <1 s, the response to a single stimulus (red trace in B) was subtracted prior to the evaluation due to ongoing decay of the first transient. Data in (C) are mean ± SEM of 29 neurons. Significance was tested in (C) by a paired student’s t-test comparing ΔF/F0 values of the first and second response; significance levels are indicated with ***p < 0.001, n.s.: p > 0.05. (D) Trains with 10 AP were applied with different frequencies as indicated and the area under the curves were normalized to the response to the standard frequency 50 Hz (inset; n = 148/3).
