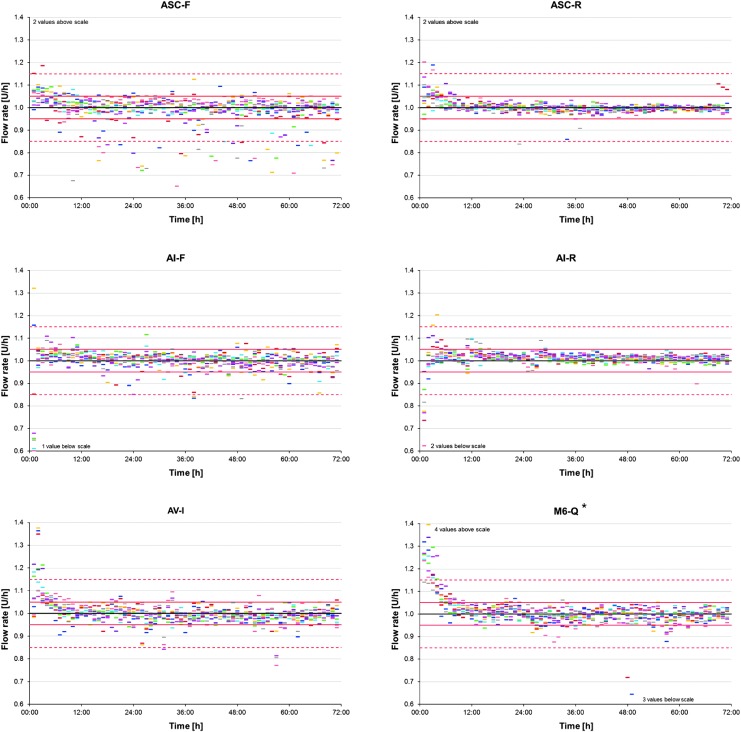
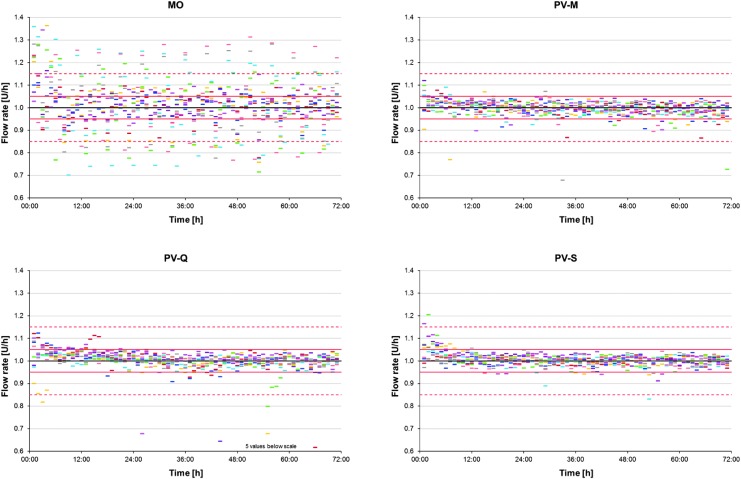
FIG. 3.
Basal rate accuracy of 1-h windows in the course of time for each insulin pump system. Colored dashes show the flow rate of 1-h windows calculated from weight increases for the individual runs (n = 71 values for each of 9 runs), the black line shows the target rate (1.0 U/h), and red lines and red dashed lines show the ±5% and ±15% range, respectively. *The batch used in this study was recalled by the manufacturer (Medtronic reference FA785) after the investigation.


