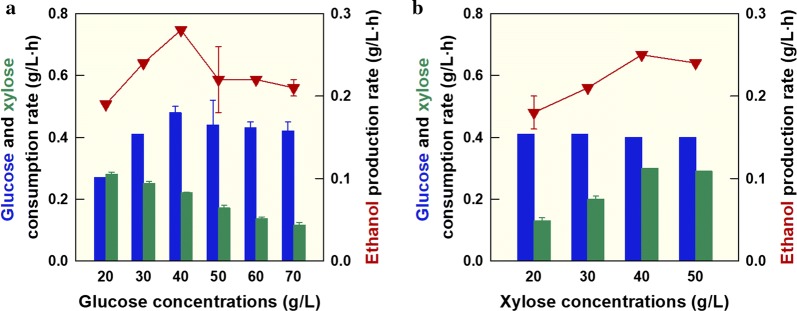
Fig. 2.
Comparisons of glucose and xylose consumption and ethanol production rates during K. marxianus SBK1 cofermentation using increasing glucose or xylose concentrations. a Increasing concentrations of glucose (20–70 g/L) with 40 g/L xylose; b increasing concentrations of xylose (20–50 g/L) with 40 g/L glucose. Symbols: glucose consumption rate (blue-filled square), xylose consumption rate (green-filled square), and ethanol production rate (filled downward pointing triangle)

