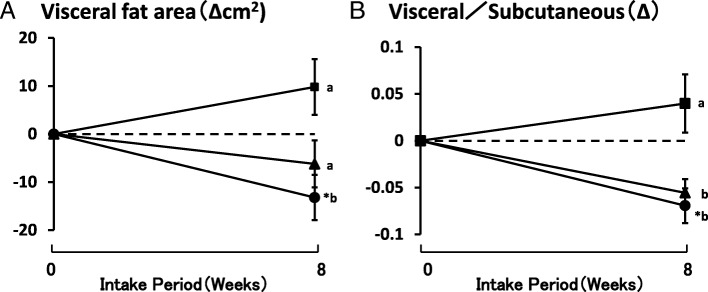
Fig. 2.
Change in VF area and ratio of visceral to subcutaneous fat area (BMI > 25). Mean ± SE of 4 (control), 4 (LAFEW 6 g), and 6 (LAFEW 8 g), a: results of Visceral fat area (Δcm2), b: Result of Visceral fat/Subcutaneous fat (Δ), ■: Control group, ▲: LAFEW 6 g group, ●: LAFEW 8 g group, *: p < 0.05 vs. 0 weeks by paired t-test, Diffecent letters shown a significant Difference by Dunnett test (p < 0.05)

