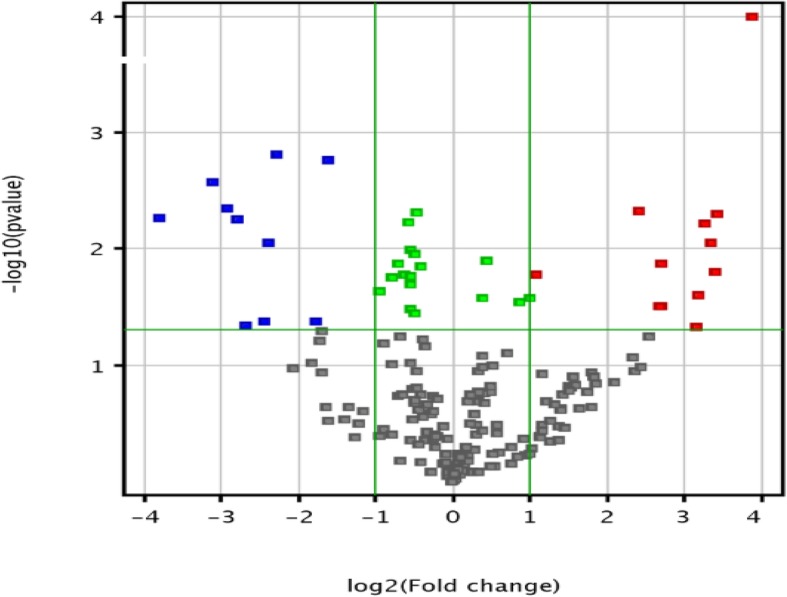
Fig. 1.

Volcano plot showing miRNAs detected by microarray. The red dots represent differential upregulation of miRNAs (fold change> 2,P > 0.05). The blue dots represent differential downregulation of miRNAs (fold change<−2,P < 0.05). The green points represent miRNAs (absolute fold change < 2,P < 0.05). The gray dots indicate the miRNAs expressed with P-value>0.05
