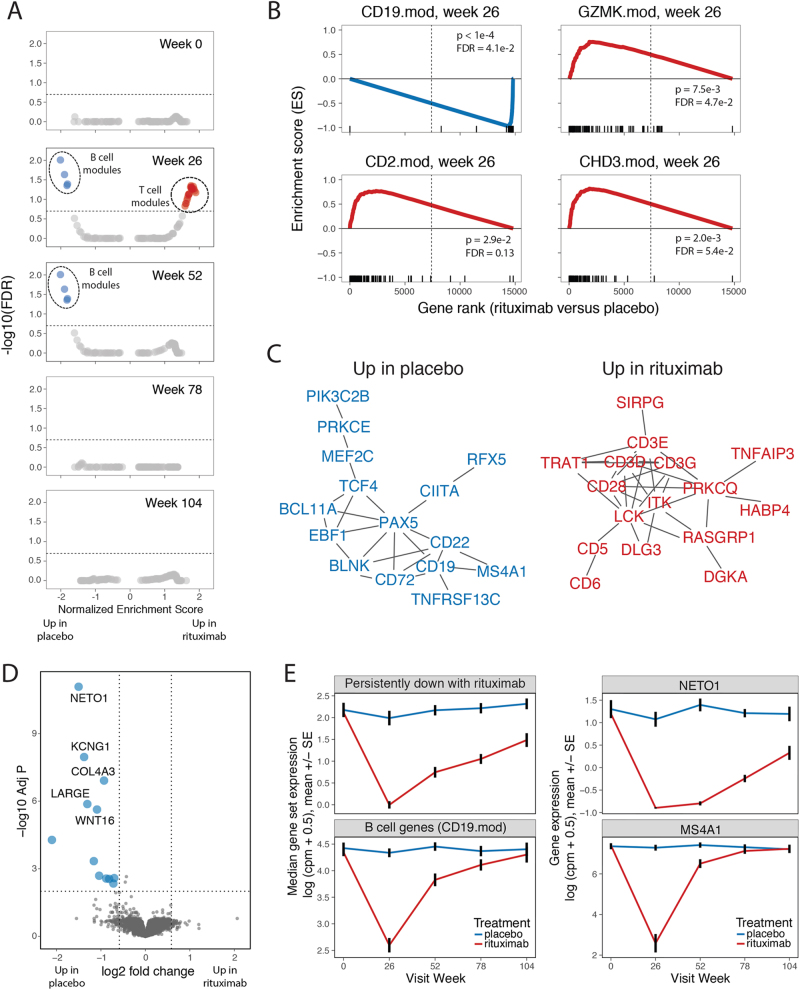
Fig. 1.
Rituximab treatment triggered transient changes in whole-blood gene module expression. a, b GSEA [12] comparing rituximab- to placebo-treated patients. a Under/over-representation of specific gene sets in whole-blood signatures from rituximab-treated individuals over the course of the study. Horizontal line indicates FDR of 0.20. Statistical tests were performed using the GSEA tool (http://software.broadinstitute.org/gsea/downloads.jsp). Blue, overexpressed in placebo-treated subjects; red, over-expression in rituximab-treated subjects. This analysis included 30, 28, 30, 27, and 20 rituximab-treated subjects at the 0, 26, 52, 78, and 104 week visits, respectively; and 13, 10, 12, 15, and 8 placebo-treated subjects at the same visits. b Selected gene sets (modules) significantly under/over-represented in rituximab-treated individuals at week 26. X axis, enrichment score; Y axis, gene rank in rituximab- vs. placebo-treated samples. Rug plots along the X-axes show differential expression ranks of module genes relative to all genes. c STRING network [14] of interactions among genes in the leading edge of gene sets significantly upregulated in rituximab-treated patients at week 26. Shown are network graphs representing the unions of genes found in multiple downregulated or upregulated modules (>1 or >4, respectively). To minimize the size of the graph, vertices (genes) were filtered to have degrees (number of adjacent connections or edges) > 1 and to represent vertices not farther than 3 connections from another fixed vertex (neighborhood). Vertices are colored as in Fig. 1a. d Differential expression of genes between the placebo- and rituximab-treated patients at the 78 week visit, performed using limma-voom [17]. Horizontal dotted line represents FDR = 0.01, vertical dotted lines represent fold change of ±1.5; center, expression of module gene sets. e Expression of representative individual genes over time in placebo-treated patients. Upper panels show genes persistently downregulated with rituximab treatment, lower panels show B cell-module genes (CD19.mod) and an established individual B cell marker gene, MS4A1 (CD20). There were N = 13 placebo and N = 30-rituximab-treated subjects tested at week 0, respectively; and N = 15 placebo and N = 27 rituximab-treated subjects at week 78. Values are means across patients; error bars show ± 1 standard error of the mean

