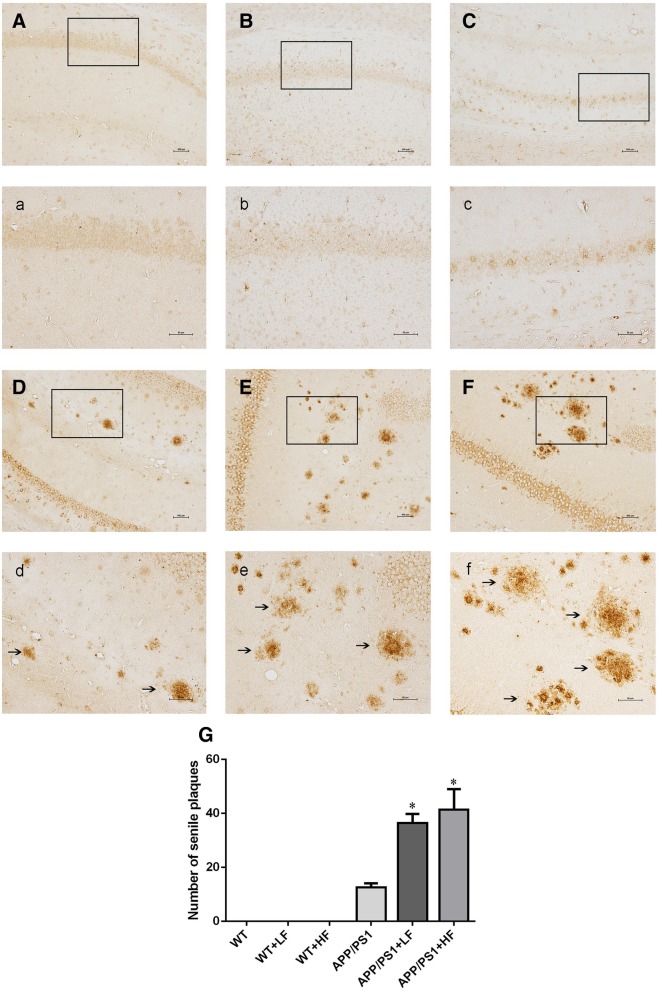
Fig. 4.
Senile plaques in the hippocampus of APP/PS1 mice following 12 weeks of exposure to fluoride. WT, wild-type; LF, low fluoride; HF, high fluoride. A, a WT mice without exposure. B, b WT receiving LF. C, c WT receiving HF. D, d APP/PS1 mice without exposure. E, e APP/PS1 mice receiving LF. F, f APP/PS1 receiving HF. Magnification: A–F, × 100, scale bar = 500 μm; a–f, × 200, scale bar = 50 μm. The solid arrows indicate senile plaques. G The numbers of senile plaques detected by 6E10 immunohistochemistry. The values shown are the means ± SD (n = 10). *P < 0.05 compared to APP/PS1 mice, as determined by analysis of variance (ANOVA), followed by the least significant differences post hoc test

