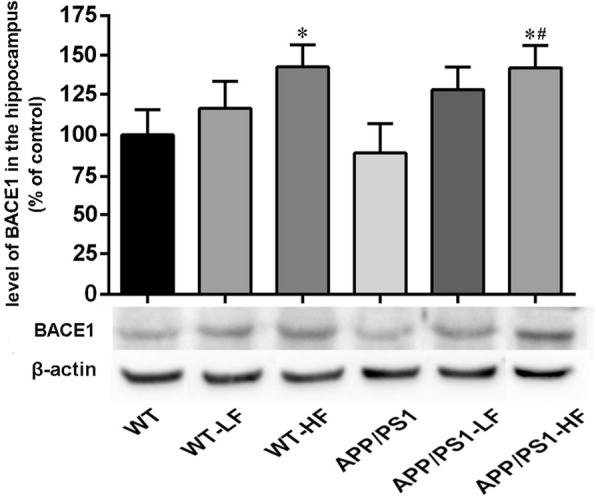
Fig. 8.

Expression of BACE1 in the hippocampus of the brains of wild-type and APP/PS1 mice after 12 weeks of exposure to fluoride. WT, wild-type; LF, low fluoride; HF, high fluoride. The levels were determined by Western blotting and the values presented are means ± SD (n = 10). *P < 0.05 in comparison to WT control; #P < 0.05 in comparison to APP/PS1 mice, as determined by analysis of variance (ANOVA), followed by the least significant differences post hoc test
