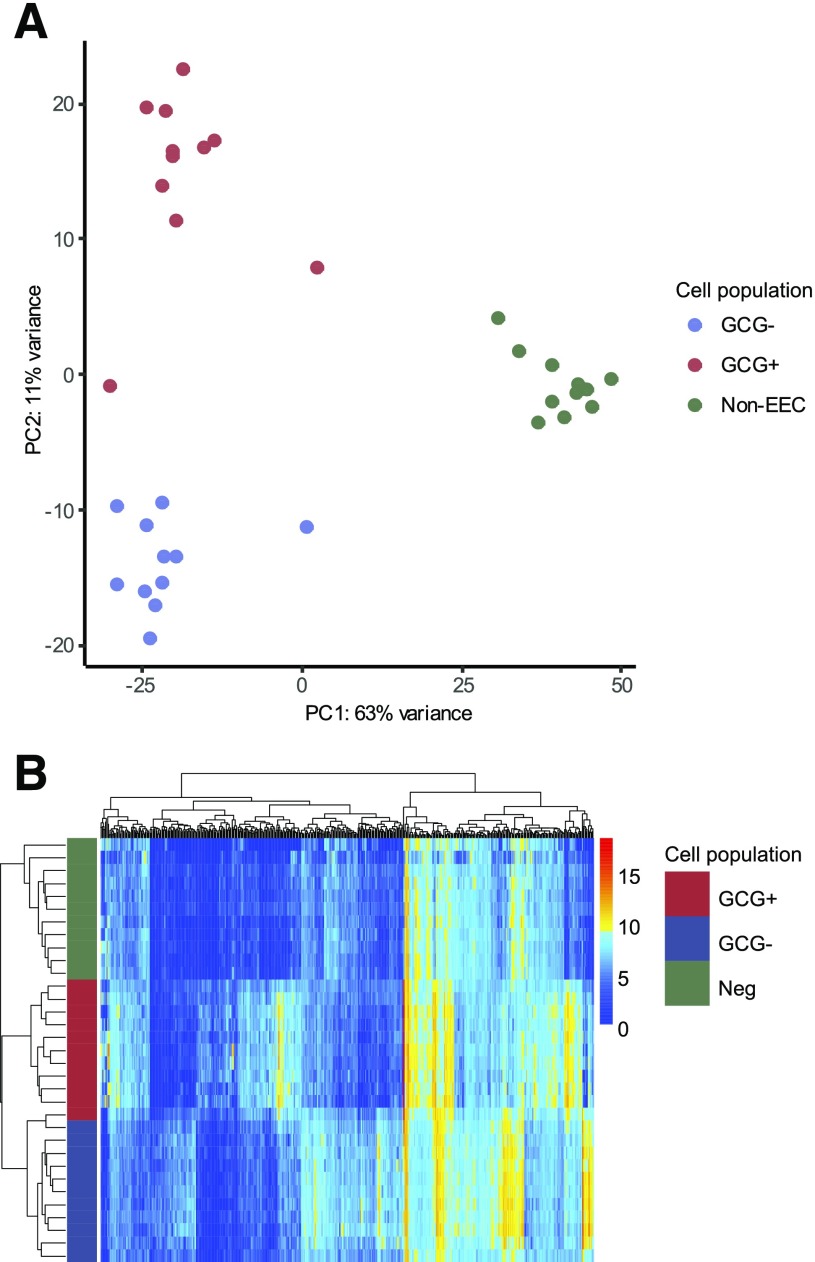
Figure 1.
Transcriptomic distinction between cell populations from human small intestine. A: Principal component (PC) analysis plot of all human samples (n = 3 cell populations from each of 11 jejunal tissue samples), differentiated by cell population. B: Pairwise analysis of key genes differentiating the cell populations from jejunum was performed using a DESEQ2 model, and the normalized results for the 500 most differentially expressed genes are presented in a heatmap (n = 3 cell populations per each of 11 participants). The y-axis is cell population identified by colored bar, and x-axis is genes.

