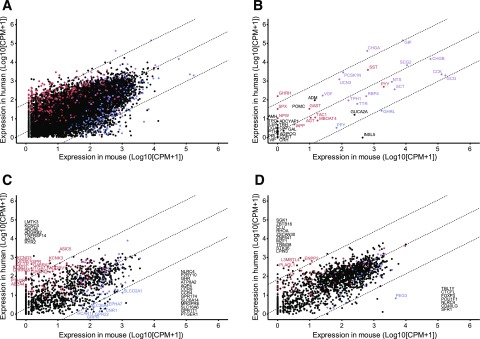
Figure 3.
Comparison between human and mouse L-cells. Human vs. mouse jejunal L-cell gene expression (log10 normalized CPM + 1; n = 11 humans, n = 3 mice). A: All genes with 1:1 homology between species, excluding mitochondrial, ribosomal, and small nuclear transcripts (n = 15,507). B: Hormones. C: GPCRs and ion channels. D: Transcription factors. Dashed lines are linear regression and 99% CI. Each dot represents normalized CPM + 1 for one gene. Red, enriched (>fourfold change) and differentially expressed (adjusted P ≤ 0.1) for human GCG+ vs. negative cell populations, but not murine GLU-Venus vs. negative cell populations in relevant DESEQ2 model. Blue, enriched and differentially expressed for murine GLU-Venus vs. negative cell populations, but not human GCG+ vs. negative cell populations. Purple, enriched and differentially expressed in both murine GLU-Venus and human GCG+ cells vs. relevant negative cell populations. Black, not enriched or differentially expressed in either human GCG+ or murine GLU-Venus cells vs. relevant negative cell populations. All genes are labeled in B, and genes outside the 99% CI are labeled in C and D, with those not differentially expressed or enriched in either population listed along the axis.

